doi: 10.56294/mw2023111
ORIGINAL
Evaluating Physician-Patient Communication: Comparing Observer Ratings and Frequency-Based Measures
Evaluación de la comunicación médico-paciente: Comparación de las valoraciones de los observadores y las medidas basadas en la frecuencia
Subhashree Ray1 ![]() *, Manashree
Mane2
*, Manashree
Mane2 ![]() , Money Saxena3
, Money Saxena3 ![]()
1IMS and SUM Hospital, Siksha ‘O’ Anusandhan (deemed to be University), Department of Biochemistry. Bhubaneswar, Odisha, India.
2JAIN (Deemed-to-be University), Department of Forensic science. Bangalore, Karnataka, India.
3School of Nursing, Noida International University, Greater Noida. Uttar Pradesh, India.
Cite as: Ray S, Mane M, Saxena M. Evaluating Physician-Patient Communication: Comparing Observer Ratings and Frequency-Based Measures. Seminars in Medical Writing and Education. 2023; 2:111. https://doi.org/10.56294/mw2023111
Submitted: 06-09-2022 Revised: 18-12-2022 Accepted: 24-02-2023 Published: 25-02-2023
Editor: PhD.
Prof. Estela Morales Peralta ![]()
Corresponding Author: Subhashree Ray *
ABSTRACT
Effective patient-physician communication is crucial to improving patient outcomes and satisfaction. However, assessing the quality of communication remains a challenge due to the variety of assessment techniques available. The research sought to contrast various methods for measuring patient-physician communication, including such salient elements as patient involvement, physician conveyance of information, emotional content, nonverbal communication, and rapport. We analyzed 110 patient-physician consultations using two contrasting methods, such as frequency measures to capture verbal and nonverbal action and standardized ratings by professional observers. To compare them, high-level statistical processes, such as regression analysis and Spearman’s rank correlation, were used to cross-check the data obtained. The results revealed low to moderate correlations between patient and physician self-reports of communication, which were not statistically significant. However, stronger and statistically significant correlations were observed between observer ratings and frequency-based measures. These results indicate that, although each measurement method measures different dimensions of communication, the methods are complementary and provide insight into the dynamics of physician-patient communication. The research also indicates the importance of nonverbal communication and relationship building in effective communication. Frequency-based metrics were also identified as effective in assessing communication dynamics in real time, highlighting the advantages of employing multiple measurement methods for a more comprehensive assessment of communication quality.
Keywords: Physician-Patient Communication; Regression Analysis; Spearman’s Rank Correlation; Verbal and Nonverbal Behaviors; Reporting.
RESUMEN
La comunicación eficaz entre el médico y el paciente es crucial para mejorar los resultados y la satisfacción de los pacientes. Sin embargo, evaluar la calidad de la comunicación sigue siendo un reto debido a la variedad de técnicas de evaluación disponibles. La investigación trató de contrastar diversos métodos para la medición de la comunicación médico-paciente, incluyendo elementos destacados como la participación del paciente, la transmisión de información por parte del médico, el contenido emocional, la comunicación no verbal y la compenetración. Se analizaron 110 consultas médico-paciente utilizando dos métodos contrastados, como las medidas de frecuencia, para captar la acción verbal y no verbal, y las calificaciones estandarizadas de los observadores profesionales. Para compararlas, se utilizaron procesos estadísticos de alto nivel, como el análisis de regresión y la correlación de rangos de Spearman, para cruzar los datos obtenidos. Los resultados revelaron correlaciones de bajas a moderadas entre los autoinformes de comunicación de pacientes y médicos, que no fueron estadísticamente significativas. Sin embargo, se observaron correlaciones más fuertes y estadísticamente significativas entre las valoraciones de los observadores y las medidas basadas en la frecuencia. Estos resultados indican que, aunque cada método de medición mide dimensiones diferentes de la comunicación, los métodos son complementarios y aportan información sobre la dinámica de la comunicación entre médicos y pacientes. La investigación también indica la importancia de la comunicación no verbal y el establecimiento de relaciones en la comunicación eficaz. Las métricas basadas en la frecuencia también se identificaron como eficaces para evaluar la dinámica de la comunicación en tiempo real, lo que pone de relieve las ventajas de emplear varios métodos de medición para una evaluación más exhaustiva de la calidad de la comunicación.
Palabras clave: Comunicación Médico-Paciente; Análisis de Regresión; Correlación de Rangos de Spearman; Comportamientos Verbales y no Verbales; Creación de Informes.
INTRODUCTION
The most effective method of acquiring health care services is physician-patient communication behavior, or PPCB.(1) Effective communication is central to the doctor-patient consultation because it enables the exchange of important concepts and information to achieve the patient's therapeutic objectives.(2) Physicians can aid patients in the decision-making process and mitigate cognitive biases by utilizing nudges or communication strategies that produce reliable outcomes on patient choices.(3) Effective and open communication fosters collaborative decision-making, enhances patient involvement, and cultivates trust.(4) Numerous assessment methods have been established to evaluate the efficacy of communication. These include frequency-based metrics that analyze both verbal and nonverbal behaviors, along with standardized observer ratings that offer qualitative assessments.(5) Understanding the interrelationship of these assessment methods is crucial for developing comprehensive evaluation frameworks that can enhance clinical interactions and communication training.(6) It specifically looks at important essentials including rapport-building, emotional tone, nonverbal communication, patient involvement, and medical information delivery.(7)
The quality of patient-physician communication and how it affects treatment adherence and patient outcomes were examined.(8) Quality of communication in 132 doctor-patient interactions was measured for 17 physicians using three different methods, such as semantic analysis, computational modelling, and comparison analysis. The positive discourse dynamics were modelled well using the models and were validated based on self-reporting surveys. Differences are present in the effectiveness of physician communication and reflect the potential of using computational analysis in developing personalized healthcare. Physicians had a pragmatic perspective of the patient-physician relationship, with fairness, dependability, dedication, and serviceability serving as the main pillars of trust.(9) Analytic Hierarchical Processing (AHP) and ANOVA were used to evaluate a survey of 328 doctors from various healthcare organizations. The results demonstrated that professional dependability was more important than warmth in building trust than social engagement, friendship, and appreciation. These observations were supported by the consistency of the AHP and ANOVA results.
A course's efficacy in preparing medical physicists to engage with patients in a clinical context was evaluated.(10) The communication skills of participants were assessed throughout the training program conducted from 2016 to 2019 through the use of ratings, responses, and simulated consultations. T-tests and ANOVA were used to analyze the data. The program’s participants included fifteen medical physicists. There was no variation in confidence levels between residents and instructors. Responses became better, and 14 of 15 achieved competency objectives. The way measuring conditions and rater perspectives affect variation in physician-patient communication assessments was investigated.(11) Using generalizability theory, communication assessments from patients and doctors were examined with an emphasis on open communication, collaborative decision-making and patient satisfaction. A three-way interaction left a significant amount of variance unexplained, with rater viewpoint and communication dimension having the most effects.
Effective communication was essential to patient-centred treatment; however, interactions were impacted by social disparities.(12) The research looked at how language skills, education, and ethnicity affect doctor-patient interactions internationally. A survey about the conduct of their doctor and their own expectations was filled out by more than 50 000 patients. While education and language skills affected interactions, ethnicity had no effect. Patients having poorer language proficiency, particularly second-generation immigrants speaking a non-official language, reported more unfavourable encounters. Patients with greater education interacted more favorably. The aim of the research was to evaluate the influence of verbal and nonverbal communication of uncertainty by male and female oncologists on patients' trust and their intention to pursue a second opinion.(13) Former cancer patients viewed experimental video vignettes with manipulated oncologist communication and gender, then intention to seek a second opinion, experience of uncertainty and reported trust. Due in part to the heightened uncertainty, nonverbal high uncertainty decreased trust and raised the meaning to get an instant opinion. The gender of the oncologist and verbal ambiguity had no effect.
The aim was to investigate the relationship between patient-physician communication, patient loyalty to both the physician and the hospital, and the mediating role of physician loyalty.(14) A sample of 510 patients from Sakarya's public and private clinics filled out questionnaires, and structural equation modelling (SEM) was utilized to analyse the outcomes. The results specified a notable correlation between the communication among patients and physicians and the loyalty exhibited towards both the physician and the hospital, with patient loyalty mediating the effect on hospital loyalty. By measuring language similarity during clinical contacts, Latent Semantic Analysis (LSA) was used to analyze semantic similarity between patient and physician language as a communication metric.(15) In a primary care context, clinical exchanges took place between patients and doctors. LSA revealed that language similarity varied by physician gender and ethnicity and was substantially higher than chance. Female patients demonstrated an advanced degree of similarity with physicians associated to the male equivalents. Higher resemblance was linked to increased trust following the contact but decreased trust at the beginning.
METHOD
Research Design
The association between various evaluation techniques and the caliber of physician-patient communication is examined in this research using a quantitative research methodology. To enable a thorough examination of the numerous affecting factors, data and responses from doctors, patients, and professional assessors are gathered using a cross-sectional survey approach. The goal is to comprehend how these techniques affect important aspects of communication, such as rapport-building, emotional tone, information delivery, patient participation, and non-verbal clues.
Data Collection
The survey collected 110 physician-patient consultations from a variety of medical disciplines, including general practice, cancer, and cardiology. Data on important communication elements, including patient involvement, doctor information delivery, emotional tone, nonverbal communication, and rapport-building, were gathered via a standardized online questionnaire. The survey was made available online to doctors, patients, and assessors who participated in the consultations in order to reach a wide audience. Table 1 represents the demographic values for this survey and figure 1 (a) displays the outcomes of physician specialty and (b) shows the patient health condition.
|
Table 1. Demographic detail Values |
|||
|
Demographic Variable |
Category |
Frequency (n) |
Percentage (%) |
|
Physician Gender |
Male |
60 |
54,5 |
|
Female |
50 |
45,5 |
|
|
Physician Specialty |
General Practice |
40 |
36,4 |
|
Oncology |
35 |
31,8 |
|
|
Cardiology |
35 |
31,8 |
|
|
Physician Experience |
1-5 years |
25 |
22,7 |
|
6-10 years |
45 |
40,9 |
|
|
11+ years |
40 |
36,4 |
|
|
Patient Gender |
Male |
45 |
40,9 |
|
Female |
65 |
59,1 |
|
|
Patient Age |
18-30 |
20 |
18,2 |
|
31-50 |
55 |
50 |
|
|
51+ |
35 |
31,8 |
|
|
Patient Health Condition |
Chronic illness |
50 |
45,5 |
|
Acute illness |
40 |
36,4 |
|
|
No significant health issues |
20 |
18,2 |
|
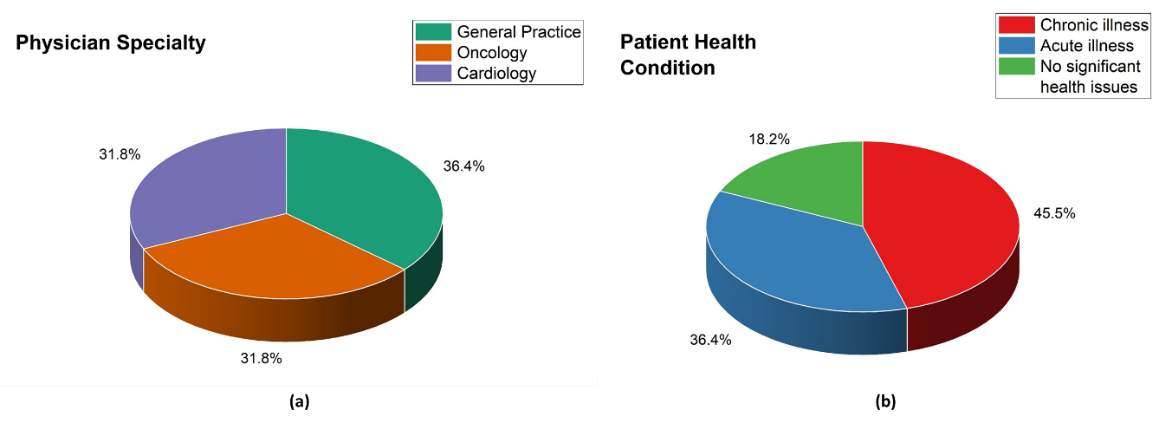
Figure 1. Results for demographic details of physician-patient (a) physician specialty and (b) patient health condition
The questionnaire was structured and included Likert scale items, with 1 indicating "strongly disagree" and 5 representing "strongly agree." Sections of the questionnaire evaluate important facets of doctor-patient communication, such as rapport-building, emotional tone, nonverbal communication, patient involvement, and physician information delivery. To guarantee fair representation across medical disciplines (cardiology, oncology, and general practice) and participant roles (physicians, patients, and professional evaluators), stratified random sampling was used during data collection. By collecting communication patterns across several specializations and consulting contexts, this approach guarantees a diversified dataset.
Statistical Analysis
The links between observer ratings, frequency-based metrics, and the quality of physician-patient communication will be investigated through the use of IBM SPSS version 25.0 for data analysis. The following statistical techniques will be applied.
Regression Analysis
This will be performed to define the predictive impact of frequency-based measures on observer-rated communication quality while accounting for physician specialty, experience, and patient demographics. The significance and strength of these predictors in explaining differences in communication quality will be evaluated by the analysis. Statistical significance will be evaluated using p-values, and R² represents the model's fraction of variation explained. Equation (1) is used to calculate the regression analysis.
![]()
Where Y represents the outcome variable, and X1, X2, X3, X4 correspond to verbal (physician), verbal (patient), non-verbal (eye contact), and non-verbal (gestures), respectively. β0 is the intercept, β1-β4 are regression coefficients, and ε represents the error term.
Spearman’s Rank Correlation
This will be utilized to determine the degree and way of the association among observer ratings and frequency-based measures. This non-parametric test can be used to analyze ordinal data or continuous data that does not satisfy the normalcy assumptions since it can assess monotonic correlations between ranked variables.
RESULTS
Correlational Analysis
Evaluate the strength and significance of relationships between the frequency-based metrics and observer ratings.
Spearman’s Rank Correlation
Correlate frequency-based metrics with observer ratings to assess the relationship between these two methods. Table 2 represents the correlation matrix values.
|
Table 2. Correlation matrix |
||||
|
Communication Component |
Verbal (Physician) |
Verbal (Patient) |
Non-Verbal (Eye Contact) |
Non-Verbal (Gestures) |
|
Patient Participation |
0,68 |
0,62 |
0,74 |
0,67 |
|
Physician Information Delivery |
0,80 |
0,58 |
0,72 |
0,69 |
|
Emotional Tone |
0,74 |
0,55 |
0,70 |
0,61 |
|
Non-Verbal Communication |
0,71 |
0,65 |
0,84 |
0,76 |
|
Rapport-Building |
0,77 |
0,59 |
0,80 |
0,74 |
The link between verbal and nonverbal behaviors and communication components in doctor-patient encounters is shown in table 2. Patient verbal communication (0,62), gestures (0,67), physician verbal communication (0,68), and eye contact (0,74) were all highly correlated with patient engagement. Physician information delivery had the highest association with physician verbal communication (0,80), followed by eye contact (0,72), gestures (0,69), and patient verbal communication (0,58). Emotional tone was most correlated with physician verbal communication (0,74) and eye contact (0,70). Non-verbal communication showed the strongest link to eye contact (0,84) and gestures (0,76), while physician verbal communication (0,71) and patient verbal communication (0,65) had moderate associations. The establishment of rapport was significantly affected by eye contact (0,80), the verbal communication of the physician (0,77), gestures (0,74), and the verbal communication of the patient (0,59). Effective communication was significantly influenced by both eye contact and the manner of speech employed by the physician. Eye contact and body language were most significant in deciding engagement and interaction quality. Both verbal and non-verbal communication contributed to emotional tone, rapport, and information exchange. The findings underscore the necessity of using verbal and non-verbal communication in instruction to enhance physician-patient interactions.
Regression Analysis
Examine the predictive value of verbal and non-verbal behaviors on overall communication quality. Table 3 shows the Regression analysis outcome values, and it is illustrated in figure 2.
Multiple Regression Model
· Dependent Variable: Observer ratings for overall communication quality.
· Independent Variables: Verbal (physician and patient) and non-verbal behaviors (eye contact, gestures).
|
Table 3. Regression results |
||||
|
Variable |
Coefficient (β) |
Standard Error(SE) |
t-Statistic |
p-Value |
|
Verbal (Physician) |
0,42 |
0,09 |
4,67 |
<0,01 |
|
Verbal (Patient) |
0,35 |
0,08 |
4,38 |
<0,01 |
|
Non-Verbal (Eye Contact) |
0,51 |
0,10 |
5,10 |
<0,01 |
|
Non-Verbal (Gestures) |
0,38 |
0,09 |
4,22 |
<0,01 |
|
Constant |
1,87 |
0,35 |
5,34 |
<0,01 |
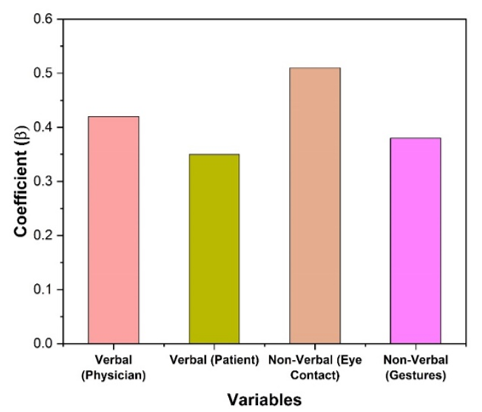
Figure 2. Outcomes of regression analysis
The findings of a regression analysis looking at how verbal and nonverbal communication affect an outcome variable are shown in table 3. The results showed a significant positive link between improved physician communication and the outcome variable, with a coefficient of 0,42, SE of 0,09, and p-value of less than 0,01. A considerable positive effect was also demonstrated by the coefficient of 0,35, SE of 0,08, and p-value of less than 0,01 for verbal communication by patients. With a coefficient of 0,51, a SE of 0,10, and a p-value of less than 0,01 showing its critical significance in effective communication, eye contact was the most influential nonverbal communication method. Gestures made a substantial contribution with a coefficient of 0,38, a SE of 0,09, and a p-value of <0,01. The constant term, which represents the result at the baseline level when all predictors are at zero, had a coefficient of 1,87, a SE of 0,35, and a p-value of less than 0,01. All of the variables were statistically significant (p < 0,01) overall, highlighting the significance of voice and nonverbal cues, especially eye contact, in affecting the result.
Self-Report Comparison
Observer ratings and frequency-based metrics with patient and physician self-reports of communication quality are compared. Table 4 shows the Correlation between self-reports and other measures and it is represented in figure 3.
|
Table 4. Correlation results between self-reports and the other measures |
||
|
Communication Component |
Self-Report (Patient) |
Self-Report (Physician) |
|
Patient Participation |
0,42 |
0,50 |
|
Physician Information Delivery |
0,39 |
0,45 |
|
Emotional Tone |
0,35 |
0,38 |
|
Non-Verbal Communication |
0,29 |
0,33 |
|
Rapport-Building |
0,40 |
0,43 |
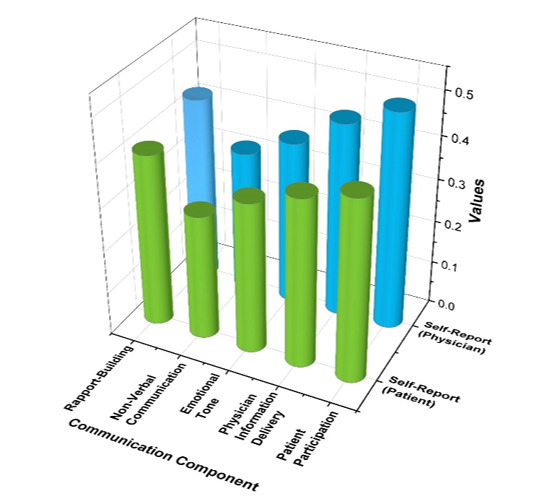
Figure 3. Outcomes of Correlation results between self-reports and the other measures
Patients' and doctors' self-reported evaluations of several aspects of doctor-patient communication are shown in table 4. The highest evaluations were given to patient engagement, with people giving it a score of 0,42 and doctors giving it a score of 0,50. This suggests that doctors thought patient involvement was more robust than patients did. The next step was physician information delivery, with patients scoring 0,39 and doctors scoring 0,45, indicating modest opinions about how well doctors communicated information. Patients and doctors gave emotional tones lower ratings (0,35) and 0,38, respectively, indicating that emotional components of communication were seen as weaker. The least effective component was nonverbal communication, as evidenced by the lowest evaluations of 0,29 from patients and 0,33 from doctors. Patients and doctors gave rapport-building comparatively higher ratings (0,40 % and 0,43, respectively), indicating that relationship-building is generally seen favorably. Overall, there was a disparity in the perceived effectiveness of communication, with doctors consistently rating all communication components higher than patients.
DISCUSSION
This research asses sed how various evaluation techniques affect doctor-patient communication and offers important information on communication analysis. The results presented in both tables highlight the essential importance of both non-verbal and verbal communication in the interactions among physicians and patients. The Spearman’s Rank Correlation table highlights how different communication components relate to verbal and non-verbal behaviors. The delivery of physician information demonstrated the strongest correlation with verbal communication from physicians, with a value of 0,80. This underscores the significance of providing clear explanations to enhance patient comprehension. The establishment of rapport was significantly associated with eye contact (0,80) and the verbal communication of physicians (0,77), indicating that successful communication encompasses both verbal expressions and visual interaction. Non-verbal communication exhibited the strongest correlation with eye contact (0,84) and gestures (0,76), highlighting the significance of body language in promoting constructive interactions. The Regression Analysis table, which presents regression results, further supports these insights. Eye contact was found to have the most significant influence on the effectiveness of communication (β = 0,51, p < 0,01). This was closely followed by verbal communication from physicians (β = 0,42, p < 0,01) and verbal communication from patients (β = 0,35,p < 0,01). This underscores the importance of verbal communication; however, it is crucial to recognize that non-verbal signals, especially eye contact, significantly enhance the interactions between physicians and patients. Furthermore, gestures played a crucial role (β = 0,38, p < 0,01), thereby underscoring the significance of non-verbal behaviors. These results indicate that communication competence is both verbal and non-verbal. Physicians who possess good verbal skills and appropriate non-verbal behavior, such as eye contact and body direction, are capable of achieving higher patient participation, emotional rapport, and quality of interaction. Because rapport building was a highly correlated variable with verbal and non-verbal behavior, training sessions need to focus on both dimensions in order to build patient.
CONCLUSIONS
The efficiency of physician-patient communication can be more thoroughly understood by evaluating it using a variety of techniques. This research shows that observer ratings and frequency-based measurements provide stronger and statistically significant insights than patient and physician self-reports, which show low to moderate correlations. These evaluation techniques' complimentary nature emphasizes the necessity of combining qualitative and quantitative techniques in order to capture various facets of communication. The results highlight how important nonverbal cues like eye contact and gestures are for building rapport and enhancing patient involvement. The findings imply that because of subjective biases, using self-reported measures alone could not give a reliable picture of communication effectiveness. Medical training programs should use evidence-based assessment methods that make use of both objective frequency-based data and observer ratings in order to improve physician-patient interactions. This research lacks real-time patient outcome assessments, has a small sample size, and may be biased by observers or self-reports. Future research should investigate cutting-edge technologies to improve healthcare interactions and further hone evaluation methods.
BIBLIOGRAPHIC REFERENCES
1. Zakaria M, Karim R, Rahman M, Cheng F, Xu J. Disparity in physician-patient communication by ethnicity: evidence from Bangladesh. International Journal for Equity in Health. 2021 Dec;20:1-9. https://doi.org/10.1186/s12939-021-01405-6
2. Krogh E, Langer Á, Schmidt C. Therapeutic presence: its contribution to the doctor-patient encounter. Journal of Continuing Education in the Health Professions. 2019 Jan 1;39(1):49-53.10. https://doi.org/1097/CEH.0000000000000232
3. Fridman I, Hart JL, Yadav KN, Higgins ET. Perspectives on using decision-making nudges in physician-patient communications. Plos one. 2018 Sep 19;13(9):e0202874. https://doi.org/10.1371/journal.pone.0202874
4. Kirkscey R. Bioethical communication: shared decision-making and relational empathy. Journal of Communication in Healthcare. 2018 Jul 3;11(3):164-74. https://doi.org/10.1080/17538068.2018.1447757
5. Schumm MA, Ohev-Shalom R, Nguyen DT, Kim J, Tseng CH, Zanocco KA. Measuring patient perceptions of surgeon communication performance in the treatment of thyroid nodules and thyroid cancer using the communication assessment tool. Surgery. 2021 Feb 1;169(2):282-8. https://doi.org/10.1016/j.surg.2020.08.019
6. Aiken LH, Sloane DM, Ball J, Bruyneel L, Rafferty AM, Griffiths P. Patient satisfaction with hospital care and nurses in England: an observational study. BMJ open. 2021 Jan 1;8(1):e019189. https://doi.org/10.1136/bmjopen-2017-019189
7. Franceschi D. Physician-patient communication: An integrated multimodal approach for teaching medical English. System. 2018 Oct 1;77:91-102. https://doi.org/10.1016/j.system.2018.02.011
8. Cuffy C, Hagiwara N, Vrana S, McInnes BT. Measuring the quality of patient–physician communication. Journal of biomedical informatics. 2020 Dec 1;112:103589. https://doi.org/10.1016/j.jbi.2020.103589
9. Berger R, Bulmash B, Drori N, Ben-Assuli O, Herstein R. The patient–physician relationship: an account of the physician’s perspective. Israel journal of health policy research. 2020 Dec;9:1-6. https://doi.org/10.1186/s13584-020-00375-4
10. Brown DW, Atwood TF, Juang T, Moore KL, MacAulay R, Bazzo D, Murphy JD, Mundt AJ, Pawlicki T. Evaluation of a patient communication skills training program for medical physicists. International journal of radiation oncology biology physics. 2020 Dec 1;108(5):1284-91. https://doi.org/10.1016/j.ijrobp.2020.07.028
11. Röttele N, Schlett C, Körner M, Farin-Glattacker E, Schöpf-Lazzarino AC, Voigt-Radloff S, Wirtz MA. Variance components of ratings of physician-patient communication: A generalizability theory analysis. Plos one. 2021 Jun 10;16(6):e0252968. https://doi.org/10.1371/journal.pone.0252968
12. Aelbrecht K, Hanssens L, Detollenaere J, Willems S, Deveugele M, Pype P. Determinants of physician–patient communication: The role of language, education and ethnicity. Patient Education and Counseling. 2019 Apr 1;102(4):776-81. https://doi.org/10.1016/j.pec.2018.11.006
13. Blanch-Hartigan D, van Eeden M, Verdam MG, Han PK, Smets EM, Hillen MA. Effects of communication about uncertainty and oncologist gender on the physician-patient relationship. Patient Education and Counseling. 2019 Sep 1;102(9):1613-20. https://doi.org/10.1016/j.pec.2019.05.002
14. Unal O, Akbolat M, Amarat M. The influence of patient-physician communication on physician loyalty and hospital loyalty of the patient. Pakistan journal of medical sciences. 2018 Jul;34(4):999.10.12669/pjms.344.15136
15. Vrana SR, Vrana DT, Penner LA, Eggly S, Slatcher RB, Hagiwara N. Latent Semantic Analysis: A new measure of patient-physician communication. Social Science & Medicine. 2018 Feb 1;198:22-6. https://doi.org/10.1016/j.socscimed.2017.12.021
FINANCING
None.
CONFLICT OF INTEREST
Authors declare that there is no conflict of interest.
AUTHORSHIP CONTRIBUTION
Conceptualization: Subhashree Ray, Manashree Mane, Money Saxena.
Data curation: Subhashree Ray, Manashree Mane, Money Saxena.
Formal analysis: Subhashree Ray, Manashree Mane, Money Saxena.
Drafting - original draft: Subhashree Ray, Manashree Mane, Money Saxena.
Writing - proofreading and editing: Subhashree Ray, Manashree Mane, Money Saxena.