doi: 10.56294/mw2023115
ORIGINAL
Examining the Role of Communication Competence in Enhancing Patient Satisfaction in Medical Environments
Examinar el papel de la competencia comunicativa en la mejora de la satisfacción del paciente en entornos médicos
Pragati
Saxena1 ![]() *, Asish Malla2
*, Asish Malla2 ![]()
1Noida International University, Department of Biotechnology and Microbiology. Greater Noida, Uttar Pradesh, India.
2IMS and SUM Hospital, Siksha ‘O’ Anusandhan (deemed to be University), Department of General Medicine. Bhubaneswar, Odisha, India.
Cite as: Saxena P, Malla A. Examining the Role of Communication Competence in Enhancing Patient Satisfaction in Medical Environments. Seminars in Medical Writing and Education. 2023; 2:115. https://doi.org/10.56294/mw2023115
Submitted: 08-09-2022 Revised: 20-12-2022 Accepted: 25-02-2023 Published: 26-02-2023
Editor:
PhD. Prof. Estela Morales Peralta ![]()
Corresponding Author: Pragati Saxena *
ABSTRACT
In medical environments, communication competence refers to a healthcare provider’s ability to convey information, listen actively, demonstrate empathy, and use appropriate verbal and non-verbal cues to engage with patients. An effective relationship between medical care providers and patients is a critical factor in ensuring high-quality medical care and enhancing patient satisfaction (PS). This research examines the role of communication competence (CC) in enhancing PS within medical settings. The research was conducted across three major hospitals, involving a total of 120 patients and 120 healthcare providers, including physicians and nurses. Data collection incorporated structured surveys and in-depth interviews, with communication competence measured using the Healthcare Communication Competency Scale and patient satisfaction assessed through the PS Questionnaire. Statistical analyses included Pearson’s correlation analysis, descriptive statistics, and multiple linear regression models to determine the predictive power of communication competence on PS while controlling for demographic factors. Additionally, qualitative thematic analysis was employed to explore patients’ perceptions of communication effectiveness. Results indicate an important direct correlation (r = 0,78, p < 0,001) between communication competence and patient satisfaction. Regression analysis further establishes that communication competence is a strong analyst of PS, highlighting that clear explanations, active listening, and empathetic interactions significantly enhance the patient experience. Patients who perceived their healthcare providers as highly competent communicators reported greater trust, reduced anxiety, and increased adherence to treatment recommendations. Healthcare providers with strong communication skills foster better patient trust, engagement, and adherence to treatment.
Keywords: Communication Competence; Patient Satisfaction; Medical Environment; Trust; Adherence.
RESUMEN
En los entornos médicos, la competencia comunicativa se refiere a la capacidad de un profesional sanitario para transmitir información, escuchar activamente, demostrar empatía y utilizar señales verbales y no verbales adecuadas para relacionarse con los pacientes. Una relación eficaz entre los profesionales sanitarios y los pacientes es un factor crítico para garantizar una atención médica de alta calidad y mejorar la satisfacción del paciente (SP). Esta investigación examina el papel de la competencia comunicativa (CC) en la mejora de la SP en entornos médicos. La investigación se llevó a cabo en tres grandes hospitales, con un total de 120 pacientes y 120 profesionales sanitarios, entre médicos y enfermeras. La recogida de datos incluyó encuestas estructuradas y entrevistas en profundidad. La competencia comunicativa se midió mediante la Escala de Competencia en Comunicación Sanitaria y la satisfacción del paciente se evaluó mediante el Cuestionario de PS. Los análisis estadísticos incluyeron el análisis de correlación de Pearson, estadísticas descriptivas y modelos de regresión lineal múltiple para determinar el poder predictivo de la competencia comunicativa sobre la SP, controlando al mismo tiempo los factores demográficos. Además, se empleó un análisis temático cualitativo para explorar las percepciones de los pacientes sobre la eficacia de la comunicación. Los resultados indican una importante correlación directa (r = 0,78, p < 0,001) entre la competencia comunicativa y la satisfacción del paciente. El análisis de regresión establece además que la competencia comunicativa es un fuerte analista de la SP, destacando que las explicaciones claras, la escucha activa y las interacciones empáticas mejoran significativamente la experiencia del paciente. Los pacientes que percibían a sus profesionales sanitarios como comunicadores muy competentes manifestaron una mayor confianza, una reducción de la ansiedad y un mayor cumplimiento de las recomendaciones terapéuticas. Los profesionales sanitarios con buenas dotes de comunicación fomentan la confianza, el compromiso y el cumplimiento terapéutico de los pacientes.
Palabras clave: Competencia Comunicativa; Satisfacción del Paciente; Entorno Médico; Confianza; Adherencia.
INTRODUCTION
Medical environments require enhanced patient satisfaction (PS) for better quality healthcare and improved patient outcomes.(1) Healthcare facilities must use PS on surveys to increase both patient treatment outcomes and service quality standards. PS stands as a measurement tool used to determine how patients evaluate their healthcare encounters in medical facilities. Healthcare facilities that deliver better PS achieve improved clinical results, better patient adherence and stronger trust from patients in health professionals. The medical environment within these settings, e.g., the physical setting, organizational culture, and patient-physician interactions, has an important impact on the experiences of the patients. Cleanliness, noise, and the presence of medical equipment are some of the factors that determine the overall atmosphere, impacting patient comfort and satisfaction.(2)
Successful interactions between health professionals and patients are critical to positive healthcare experiences. Evidence indicates that effective communication, listening, and empathy significantly contribute to PS. Patients who feel that their providers communicate well build higher trust, suffer less anxiety, and are better adherent to recommendations.(3) Maintaining high-quality care and patient safety is a top concern across the world. Also, integrating individualized care plans, reducing waiting times, and enhancing patient education raise levels of fulfilment. Giving regular feedback through surveys, upholding patient dignity, and sustaining advocacy programs also enhance overall patient involvement and the quality of medical care services.(4) Figure 1 shows the PS in a medical environment.
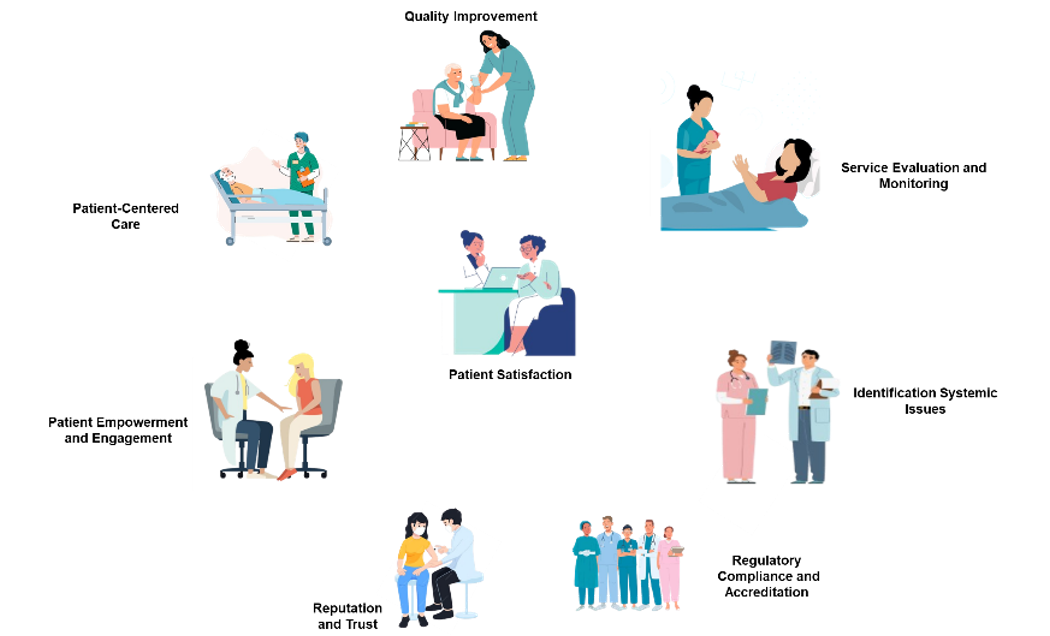
Figure 1. PS in a medical environment
The use of innovative technologies, including interactive patient care systems, is important in enhancing patient participation and overall satisfaction. A PS-focused strategy that incorporates effective communication, individualized care, and efficient healthcare processes is vital in enhancing the patient experience. Effective delivery of services minimizes waiting times, and easy access to medical information also enhances patient trust and comfort. Also, encouraging good patient-provider relationships through listening and empathetic communication can increase treatment plan adherence. By using technology and sound communication strategies, healthcare providers can establish an environment that focuses on patient needs, resulting in improved healthcare experiences and better health outcomes.(5) The purpose of the analysis is to investigate how communication competence (CC) can improve PS in healthcare environments. Using statistical analysis (SA), the research identifies key predictors of satisfaction and provides insights for improving medical interactions.
PS in public hospitals was evaluated, focusing on facility services, physician-patient communication, and medical care services. Data from 445 outpatient respondents were analyzed using regression analysis.(6) Results showed significant impacts from medical care services, while physician-patient communication and physical facilities showed insignificant effects. Limitations included focusing on outpatient information. The connection between nurse burnout and PS was examined, along with an assessment of the impact of work environments on these outcomes. A cross-sectional analysis was conducted across 463 hospitals using the Maslach Burnout Inventory and HCAHPS survey.(7) Results showed high burnout and poor work environments correlated with lower patient satisfaction. Limitations included the analysis of observational design and regional focus.
PS with medical care services and the moderating effect of physician behaviour were investigated.(8) A descriptive survey design was used with 290 participants from three public hospitals. Regression analysis found that healthcare services positively impacted satisfaction, with physician behaviour moderating this effect. Limitations included the use of convenient sampling. Worker work satisfaction and PS were evaluated in public hospitals.(9) Transversal research was conducted in 14 medical institutions with medical team members and patients. Findings revealed average medical staff satisfaction and satisfactory PS. Limitations included the focus on specific regions and factors influencing fulfilment. The influence of service quality on PS was investigated in the research.(10) Data were collected from 194 patients in Melaka and Johor using a structured questionnaire and analyzed with Smart Partial Least Squares (SmartPLS) software. The results revealed that hospital structure, patient protection, individual quality, and social responsibility significantly predicted satisfaction. Limitations included the regional focus.
METHOD
The methodology involves data collection using questionnaires, analysis of statistical variables, and the application of statistical techniques to evaluate patient education in medical environments comprehensively.
Data Collection
The research was conducted across three main hospitals, with 120 patients and 120 health professionals, including physicians and nurses. The data were gathered using structured questionnaires and qualitative interviews, ensuring a complete understanding of communication competence and PS. The questionnaires captured patients' experiences, while the interviews provided healthcare providers insights into communication processes. Table 1 describes the demographic details.
|
Table 1. Demographic details |
||
|
Variables |
Categories |
Frequency Range |
|
Age |
At 18 18-30, 31-45, 46-60, 60+ |
20-30 participants per range |
|
Gender |
Male, Female |
50-70 % male/female |
|
Healthcare Provider Type |
Physician, Nurse |
60 %, 40 % |
|
Patient Health Status |
Healthy, Chronic Condition, Acute Condition |
30-50 % healthy, 20-40 % chronic, 20-30 % acute |
|
Length of Hospital Stay |
<1 week, 1-2 weeks, >2 weeks |
30-50 % <1 week, 20-40 % 1-2 weeks, 20-30 % >2 weeks |
|
Experience with Healthcare Providers |
First visit, Multiple visits |
30-40 %, 60-70 % |
Questionnaire
Data collected used structured questionnaires and in-depth interviews, centering on patient satisfaction and communication competence. 120 patients and 120 providers of health care, involving physicians and nurses, participated in the research. CC was assessed through the use of the Healthcare Communication Competency Scale, covering issues such as empathy, clarity, and active listening. PS was assessed using the PS Questionnaire, incorporating both open-ended questions and quantitative scales. Respondents offered opinions on the effectiveness of communication, treatment satisfaction, and general care experience. The gathered opinions provide insights into how communication behaviour affects PS and healthcare outcomes.
Reliability Analysis
To evaluate the internal consistency of the questionnaire, a high Cronbach’s alpha score of 0,92 confirmed its strong consistency in measuring communication competence and patient satisfaction across different participants. Additionally, the questionnaire demonstrated strong construct validity, aligning with established healthcare communication frameworks. Positive correlations between the individual response and overall scores also established its reliability. The findings validated that the tool successfully measured the most important variables, like clarity, empathy, and active listening, which accurately perceived healthcare provider communication and how it affected PS.
Selection criteria
Inclusion Criteria
Participants must be patients aged 18 or older, receiving care at the selected hospitals, and capable of providing informed consent. Healthcare providers must be physicians or nurses who are actively involved in patient care.
Exclusion Criteria
Patients under 18, those who are unable to provide consent or those with severe cognitive impairments were excluded. Healthcare providers with less than six months of experience in direct patient care or those on administrative duties were also excluded.
Statistical Variables
Identifying important statistical variables, such as Patient Satisfaction (PS), Healthcare Service Quality (HSQ), Physician-Patient Relationship Quality (PPRQ), and Communication Competence (CC), Waiting Time for Services (WTS), and Hospital Type and Provider Workload (HTPW), provides insights into healthcare effectiveness. The statistical variable, as shown in figure 2, illustrates their relationships and impact on PS in a medical environment.
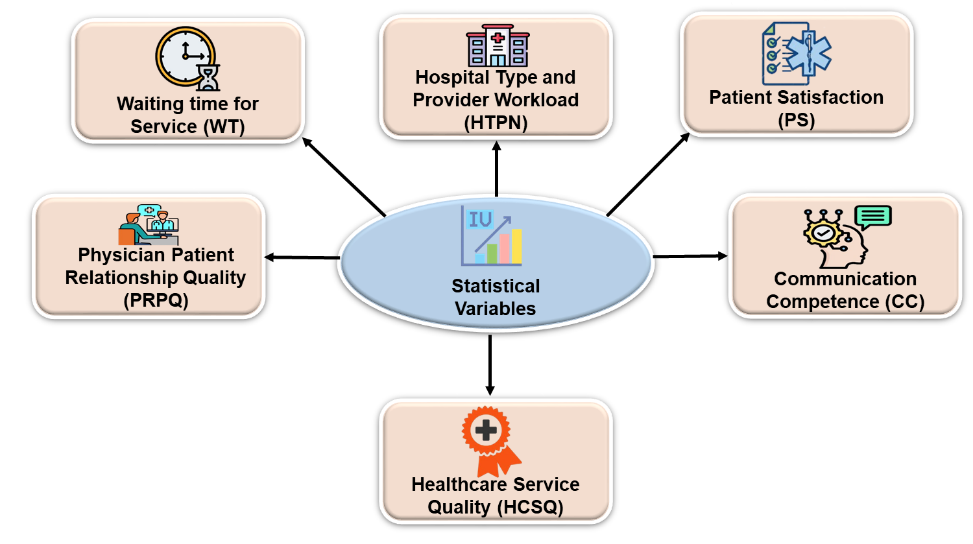
Figure 2. Main Statistical Variables on PS in Medical Environment
Communication Competence (CC)
CC evaluates healthcare professional’s clarity, empathy, active listening, and patient commitment. Robust connection fosters trust, improves patient understanding, and ensures superior treatment adherence, significantly persuading overall PS within healthcare environments.
Patient Satisfaction (PS)
PS measures overall contentment with healthcare services, including communication, trust, service quality, and emotional support. PS develops the hospital's reputation, leading to increased service utilization and market share. It profits medical providers by improving continued care, favourable recommendations, and increasing financial gain. Satisfaction arises from comparing actual healthcare experiences with patients' expectations, influencing overall perceptions of care quality.
Healthcare Service Quality (HSQ)
HSQ includes hygiene, organization, timeliness, and resource availability. A well-maintained environment with efficient services directly impacts patient perceptions, leading to developed satisfaction and improved outcomes in the healthcare environment.
Physician-Patient Relationship Quality (PPRQ)
PPRQ assesses trust, shared decision-making, and emotional support between patients and physicians. A robust physician-patient relationship improves treatment adherence, reduces anxiety, and enhances overall patient satisfaction in healthcare settings.
Waiting Time for Services (WTS)
WTS measures appointment scheduling efficiency, emergency response times, and consultation duration. Reduced waiting periods enhance patient experience, minimize frustration, and contribute to higher satisfaction with medical care.
Hospital Type and Provider Workload (HTPW)
HTPW compares public and private hospitals while considering physician workload. A higher provider workload often reduces communication quality and care efficiency, affecting patient satisfaction negatively in medical environments.
Statistical Analysis
Important variables were identified using Statistical Package for the Social Sciences (SPSS) software through the examination, including Hospital Type and Provider Workload (HTPW), Waiting Time for Services (WTS), Physician-Patient Relationship Quality (PPRQ), Healthcare Service Quality (HSQ), Patient Satisfaction (PS), and Communication Competence (CC). Descriptive analysis summarized data trends, Pearson's correlation evaluated relationships, multiple linear regression determined predictive variables, and thematic analysis investigated qualitative perceptions of patient experiences.
Descriptive Analysis (DA)
DA is a statistical method used to summarize and interpret data by important measures. In this research, DA was performed to understand the distribution, trends, and variability of communication competence and patient satisfaction. By analyzing historical data, this method helps identify patterns and relationships without making predictions or causal inferences. It serves as the foundation for further SA, providing insights into healthcare providers' communication effectiveness and its impact on PS within medical environments. Equation (1) represents the mean and equation (2) illustrates the standard deviation.
![]()
Standard deviation:
![]()
Where, individual value is represented as Ui, Total observations as N, and Mean of the dataset as U ̅.
Pearson’s Correlation Analysis
This analysis assists in exploring the correlation between communication competence and PS. Through the comparison of coefficient values between -1 and 1, this process established whether better communication skills from healthcare providers correlated with higher PS levels is shown in equation (3). A strong positive correlation implies that good communication greatly improves patient experiences, underscoring the significance of communication competence in health settings.
![]()
Where, Pearson correlation coefficient (R), Individual data points (Ui and Qi), Mean variables (U and Q).
Multivariate linear regression (MLR) Analysis
It is the statistical technique employed to forecast a dependent variable using a combination of independent variables. The current research assesses the impact of communication competence on PS after accounting for other variables. This analysis helps identify key predictors, ensuring a complete understanding of influences affecting PS in medical environments. MLR analysis follows a mathematical equation (4).
![]()
Where, β1, β2,….βn is the regression coefficients, Y1, Y2 …Yn is the independent variable, the Error term is, the dependent variable is denoted as X.
Thematic Analysis
It is a qualitative method used to identify, analyze, and interpret patterns in textual information. The research explored patients' perceptions of healthcare communication competence by analyzing interview responses. Important themes, such as empathy, clarity, and active listening, were identified, providing more profound insights into how communication influences PS in medical surroundings.
RESULT AND DISCUSSION
This section presents the statistical performance analysis using multiple methods, highlighting key findings. It also examines the limitations of the medical environment in achieving patient satisfaction, addressing challenges affecting healthcare quality and patient experiences. Table 2 and figure 3 present the outcomes of Descriptive Analysis (DA), highlighting key statistical measures and variable distributions.
|
Table 2. Results of DA |
|||||||
|
Variables |
N |
Mean (M) |
Minimum |
Maximum |
Standard Deviation (SD) |
Skewness |
Kurtosis |
|
HTPW |
240 |
3,85 |
2,00 |
5,00 |
0,76 |
0,45 |
2,10 |
|
WTS |
240 |
4,25 |
1,00 |
5,00 |
0,89 |
0,68 |
2,35 |
|
PPRQ |
240 |
4,10 |
2,50 |
5,00 |
0,72 |
0,52 |
2,85 |
|
HSQ |
240 |
4,30 |
2,80 |
5,00 |
0,65 |
0,61 |
3,05 |
|
PS |
240 |
4,15 |
2,00 |
5,00 |
0,80 |
0,48 |
2,90 |
|
CC |
240 |
4,05 |
2,30 |
5,00 |
0,70 |
0,50 |
2,75 |
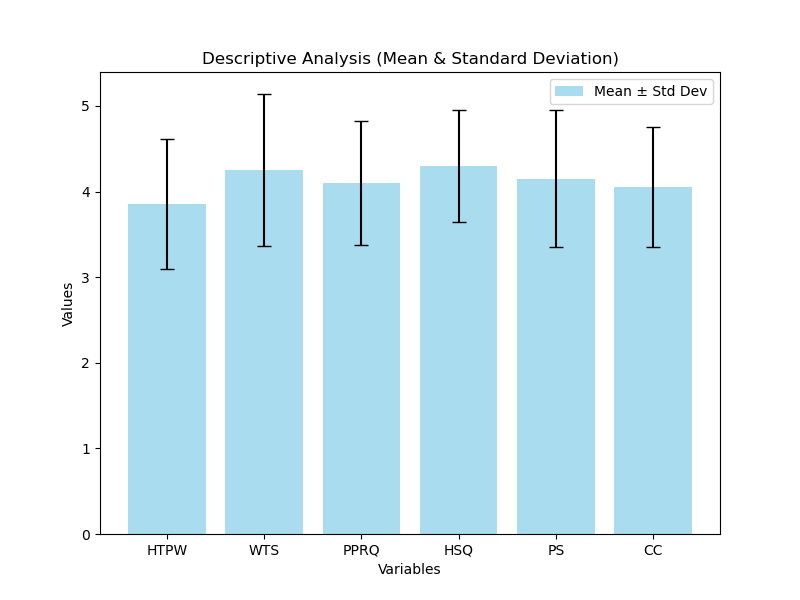
Figure 3. Visual representation of DA
The DA table and bar chart highlight variations in key variables influencing PS in a medical environment. HSQ (M = 4,30, SD = 0,65) shows the highest performance, indicating that HSQ plays a crucial role in PS. WTS (M = 4,25, SD = 0,89) and PS (M = 4,15, SD = 0,80) also show robust contributions. HTPW (M = 3,85, SD = 0,76) exhibits lower performance, suggesting room for improvement. The error bars indicate variations, with WTS showing the highest variability, reflecting differing patient experiences. Enhancing communication competence (M = 4,05, SD = 0,70) can further improve satisfaction levels. Table 3 and figure 4 display the outcome of MLR analysis, showcasing the predictive connection between key variables and PS.
|
Table 3. Result of MLR Analysis |
|||||||
|
Variables |
Unstandardized Coefficients (B) |
Standard Error |
Standardized Coefficients(β) |
t-value |
Tolerance |
Lower Bound (95 %) |
Upper Bound (95 %) |
|
HTPW |
0,250 |
0,045 |
0,320 |
5,56 |
0,75 |
0,162 |
0,338 |
|
WTS |
0,180 |
0,038 |
0,290 |
4,74 |
0,82 |
0,105 |
0,255 |
|
PPRQ |
0,340 |
0,050 |
0,410 |
6,80 |
0,78 |
0,242 |
0,438 |
|
HSQ |
0,295 |
0,042 |
0,360 |
6,15 |
0,80 |
0,212 |
0,378 |
|
PS |
0,220 |
0,040 |
0,305 |
5,50 |
0,79 |
0,142 |
0,298 |
|
CC |
0,620 |
0,038 |
0,620 |
8,20 |
0,76 |
0,545 |
0,695 |
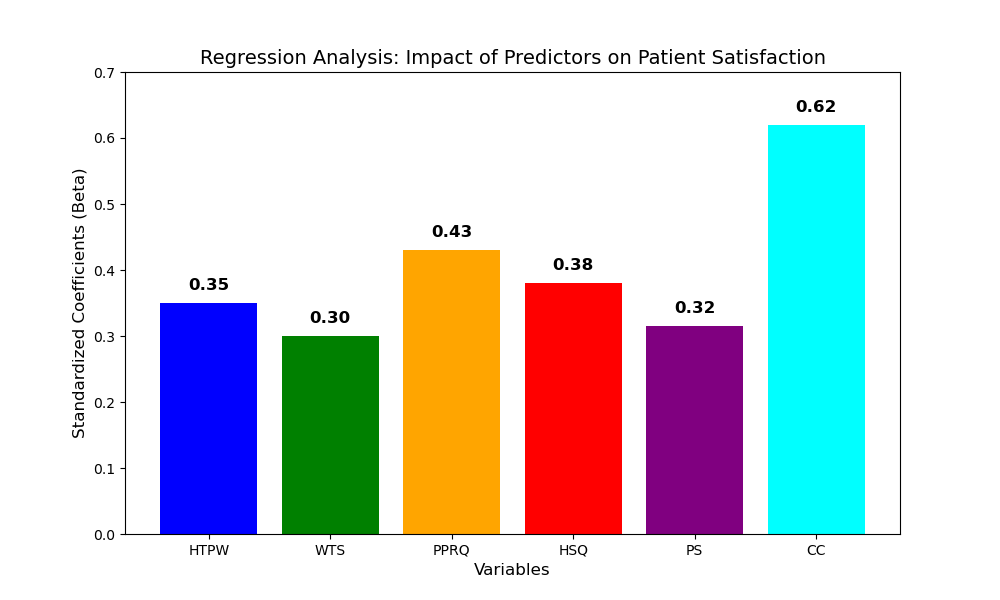
Figure 4. Visual representation of MLR Analysis
The MLR bar chart highlights the impact of important variables on PS using Standardized Coefficients (β) values from the regression analysis. CC (0,620) has the strongest impact, emphasizing the role of clear explanations, active listening, and empathy in enhancing patient experiences. PPRQ (0,438) and HSQ (0,378) are also significant predictors. HTPW (0,250) and WTS (0,180) moderately affect satisfaction. MLR analysis shows that CC (β = 0,620, p < 0,001) strongly predicts PS. Flawless explanations, active listening, and empathy significantly improve experiences, emphasizing the need for effective communication in healthcare settings. Table 4 and figure 5 illustrate the result of Correlation analysis (CA), showcasing the predictive relationship between important variables and PS.
|
Table 4. Result of CA |
||||||
|
Variables |
HTPW |
WTS |
PPRQ |
HSQ |
PS |
CC |
|
HTPW |
1,00 |
0,65 |
0,72 |
0,68 |
0,75 |
0,70 |
|
WTS |
0,65 |
1,00 |
0,79 |
0,74 |
0,82 |
0,76 |
|
PPRQ |
0,72 |
0,79 |
1,00 |
0,77 |
0,80 |
0,73 |
|
HSQ |
0,68 |
0,74 |
0,77 |
1,00 |
0,85 |
0,78 |
|
PS |
0,75 |
0,82 |
0,80 |
0,85 |
1,00 |
0,78 |
|
CC |
0,70 |
0,76 |
0,73 |
0,78 |
0,78 |
1,00 |
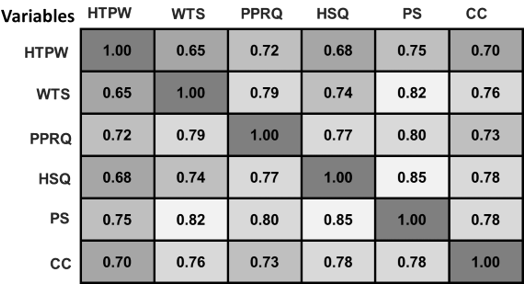
Figure 5. Visual representation of CA
The CA examines the main factors influencing PS in the medical environment. A robust direct relationship (r = 0,78, p < 0,001) between PS and CC indicates that clear explanations, active listening, and empathy significantly improve patient understanding. HSQ and PS (r = 0,85) show the strongest relationship, emphasizing service quality’s direct impact. WTS (r = 0,82) and PPRQ (r = 0,80) also positively influence PS. Improving CC and HSQ is crucial for enhancing PS.
Thematic analysis is employed to observe the important factors influencing PS in healthcare. CC (M = 4,05, SD = 0,70) strongly correlates with PS (r = 0,78, p < 0,001), highlighting the significance of clear explanations and empathy. HSQ (M = 4,30, SD = 0,65) has the highest impact (r = 0,85), emphasizing efficient medical care. WTS (M = 4,25, SD = 0,89) also significantly affects PS (r = 0,82). PPRQ (M = 4,10, SD = 0,72) (r = 0,80) further enhances trust, while HTPW moderately contributes (r = 0,75). Additionally, qualitative thematic analysis was employed to explore patients’ perceptions of communication effectiveness.
DISCUSSION
The influence of CC on PS in medical environments was investigated in the research. It explores how clear explanations, active listening, and empathy influence trust and treatment adherence. Patient satisfaction in medical environments is influenced by various limitations. Subjective experiences differ among patients, thus making it hard to standardize assessment. Hospital infrastructure, workload of staff, and extraneous factors (e.g., socioeconomic status) might influence satisfaction but are hard to manage. Survey response bias may also compromise accuracy. Cultural variability affects patient expectations and experiences. Low example proportions and cross-sectional research designs could limit generalizability. Subsequent research must investigate AI-based sentiment analysis, real-time patient feedback systems, and longitudinal research to further improve predictive models. Telemedicine and personalized communication strategies can further improve patient satisfaction in medical environments.
CONCLUSIONS
The function of CC in improving PS in medical settings was investigated in this research. The research was carried out in three large hospitals, among 120 patients and 120 healthcare professionals, such as physicians and nurses. Data were collected using structured questionnaires and interviews. CC was assessed using the Healthcare CC Scale and PS using the PS Questionnaire. For analysis, DA, Pearson’s correlation analysis, and MLR models were engaged to estimate the analytical power of CC on PS while directing for demographic factors. Furthermore, qualitative thematic analysis provided deeper insights into patients' perceptions of communication effectiveness, highlighting key factors influencing their overall healthcare experience. Results revealed an important strong association (r = 0,78, p < 0,001) between CC and PS. MLR analysis confirmed CC as a strong predictor of PS (β = 0,62, p < 0,001). HSQ (r = 0,85) has the strongest impact on PS, followed by WTS (r = 0,82) and PPRQ (r = 0,80), while HTPW (r = 0,75) has the lowest impact. Healthcare providers with strong communication skills foster better trust, engagement, and treatment adherence among patients. Enhancing communication training in medical education can significantly improve healthcare outcomes. Limitations of the research are constrained by its concentration on specific hospitals, potential self-reporting bias, and lack of longitudinal data. Future research should incorporate larger, diverse populations, real-time patient feedback systems, and AI-driven predictive models for enhanced healthcare service optimization.
BIBLIOGRAPHIC REFERENCES
1. Larson E, Sharma J, Bohren MA, Tunçalp Ö. When the patient is the expert: measuring patient experience and satisfaction with care. Bulletin of the World Health Organization. 2019 May 28;97(8):563. https://doi.org/10.2471/BLT.18.225201
2. Ampaw EM, Chai J, Liang B, Tsai SB, Frempong J. Assessment on health care service quality and patients’ satisfaction in Ghana. Kybernetes. 2020;49(12):3047-68. https://doi.org/10.1108/K-06-2019-0409
3. Lee D. A model for designing healthcare service based on the patient experience. International Journal of Healthcare Management. 2019 Jul 3;12(3):180-8. https://doi.org/10.1080/20479700.2017.1359956
4. Boamah SA, Laschinger HK, Wong C, Clarke S. Effect of transformational leadership on job satisfaction and patient safety outcomes. Nursing outlook. 2018 Mar 1;66(2):180-9. https://doi.org/10.1016/j.outlook.2017.10.004
5. Wykes T, Csipke E, Williams P, Koeser L, Nash S, Rose D, Craig T, McCrone P. Improving patient experiences of mental health inpatient care: a randomised controlled trial. Psychological medicine. 2018 Feb;48(3):488-97. https://doi.org/10.1017/S003329171700188X
6. Ali BJ, Gardi B, Othman BJ, Ahmed SA, Ismael NB, Hamza PA, Aziz HM, Sabir BY, Sorguli S, Anwar G. Hotel service quality: The impact of service quality on customer satisfaction in hospitality. International Journal of Engineering Business Management. 2021 May 22;5(3):14-28. https://doi.org/10.22161/ijebm.5.3.2
7. Carthon JM, Hatfield L, Brom H, Houton M, Kelly-Hellyer E, Schlak A, Aiken LH. System-level improvements in work environments lead to lower nurse burnout and higher patient satisfaction. Journal of nursing care quality. 2021 Jan 1;36(1):7-13.. https://doi.org/10.1097/NCQ.0000000000000475
8. Manzoor F, Wei L, Hussain A, Asif M, Shah SIA. Patient satisfaction with health care services; an application of physician’s behavior as a moderator. International Journal Of Environmental Health Research. 2019;16(18):3318. https://doi.org/10.3390/ijerph16183318
9. Fatima T, Malik SA, Shabbir A. Hospital healthcare service quality, patient satisfaction and loyalty: An investigation in context of private healthcare systems. International journal of quality & Reliability Management. 2018 Jun 4;35(6):1195-214. https://doi.org/10.1108/IJQRM-02-2017-0031
10. Orom H, Underwood III W, Cheng Z, Homish DL, Scott IY. Relationships as medicine: quality of the physician–patient relationship determines physician influence on treatment recommendation adherence. Health services research. 2018 Feb;53(1):580-96. https://doi.org/10.1111/1475-6773.12629
FINANCING
No financing.
CONFLICT OF INTEREST
The authors declare that there is no conflict of interest.
AUTHORSHIP CONTRIBUTION
Data curation: Pragati Saxena, Asish Malla.
Methodology: Pragati Saxena, Asish Malla.
Software: Pragati Saxena, Asish Malla.
Drafting - original draft: Pragati Saxena, Asish Malla.
Writing - proofreading and editing: Pragati Saxena, Asish Malla.