doi: 10.56294/mw2023128
ORIGINAL
Advanced Predictive Modeling for Hypertension Risk Based on Health Indicators and Machine Learning Technique
Modelización predictiva avanzada del riesgo de hipertensión basada en indicadores de salud y técnicas de aprendizaje automático
Sujayaraj Samuel Jayakumar1
![]() *,
Ved vrat verma2
*,
Ved vrat verma2 ![]() , Udaybhanu Rout3
, Udaybhanu Rout3
![]()
1JAIN (Deemed-to-be University), Department of Forensic science. Bangalore, Karnataka, India.
2Noida International University, Department of Biotechnology. Greater Noida, Uttar Pradesh, India.
3IMS and SUM Hospital, Siksha ‘O’ Anusandhan (deemed to be University), Department of General Medicine. Bhubaneswar, Odisha, India.
Cite as: Jayakumar SS, verma V vrat, Rout U. Advanced Predictive Modeling for Hypertension Risk Based on Health Indicators and Machine Learning Technique. Seminars in Medical Writing and Education. 2023; 2:128. https://doi.org/10.56294/mw2023128
Submitted: 12-09-2022 Revised: 24-12-2022 Accepted: 27-02-2023 Published: 28-02-2023
Editor: PhD.
Prof. Estela Morales Peralta ![]()
Corresponding Author: Sujayaraj Samuel Jayakumar *
ABSTRACT
Introduction: the condition of hypertension significantly accelerates the incidence of cardiovascular diseases and demands timely and proper measurement of the avoidable risk. Traditional techniques in the measurement of the pressure in the arteries provide accurate figures but are incapable of forecasting the risk of the development of hypertension.
Objective: the goal was to establish an Efficient Pelican Optimized Dynamic Random Forest (EPO-DRF) model from health markers to forecast the hypertension probability.
Method: patient information was extracted from clinical history, such as clinical predictors and lifestyle predictors of hypertension. Preprocessing, such as normalization and cleaning, was carried out to ensure precision and consistency. The significant predictors, such as age, cholesterol, blood sugar, and BMI, were determined. Optimum pelican optimization was used to increase the predictive efficiency by identifying the most significant predictors and removing redundant predictors.
Results: to forecast the hypertension probability, the EPO-DRF model also displayed excellent outcomes, such as the F1-score (86,2 %), the accuracy (90,4 %), the sensitivity (87,5 %), and the precision (85,7 %). Classification performance and the most significant feature selection also underwent optimization in the course of the optimization to increase the efficacy of the model.
Conclusions: the novel methodology arrived at an effective and efficient way to attain hypertension screening at an early stage, in alignment with preventive care practices and minimizing hypertension complications. It also helped healthcare analytics by having a precise predictive model to project future hypertension detection, making timely intervention and enhancing outcomes among the patients.
Keywords: Hypertension Risk; Health Indicators; Efficient Pelican Optimized Dynamic Random Forest (EPO-DRF); Blood Pressure.
RESUMEN
Introducción: la condición de hipertensión acelera significativamente la incidencia de enfermedades cardiovasculares y exige una medición oportuna y adecuada del riesgo evitable. Las técnicas tradicionales en la medición de la presión en las arterias proporcionan cifras precisas pero son incapaces de pronosticar el riesgo de desarrollo de hipertensión.
Objetivo: el objetivo fue establecer un modelo Efficient Pelican Optimized Dynamic Random Forest (EPO-DRF) a partir de marcadores de salud para pronosticar la probabilidad de hipertensión.
Método: la información del paciente se extrajo de la historia clínica, como los predictores clínicos y de estilo de vida de la hipertensión. Se realizó un preprocesamiento, como la normalización y la limpieza, para garantizar la precisión y la coherencia. Se determinaron los predictores significativos, como la edad, el colesterol, la glucemia y el IMC. Se utilizó la optimización pelican óptima para aumentar la eficacia predictiva mediante la identificación de los predictores más significativos y la eliminación de los predictores redundantes.
Resultados: para predecir la probabilidad de hipertensión, el modelo EPO-DRF también mostró resultados excelentes, como la puntuación F1 (86,2 %), la exactitud (90,4 %), la sensibilidad (87,5 %) y la precisión (85,7 %). El rendimiento de la clasificación y la selección de las características más significativas también se optimizaron en el curso de la optimización para aumentar la eficacia del modelo.
Conclusiones: la novedosa metodología dio lugar a una forma eficaz y eficiente de realizar el cribado de la hipertensión en una fase temprana, en consonancia con las prácticas de atención preventiva y minimizando las complicaciones de la hipertensión. También ayudó a la analítica sanitaria al disponer de un modelo predictivo preciso para proyectar la futura detección de la hipertensión, interviniendo a tiempo y mejorando los resultados entre los pacientes.
Palabras clave: Riesgo de Hipertensión; Indicadores de Salud; Bosque Aleatorio Dinámico Optimizado Pelican Eficiente (EPO-DRF); Presión Arterial.
INTRODUCTION
Hypertension, or high blood pressure, impacts over a billion individuals worldwide and is a public health concern with high predictive values for heart disease, stroke, and renal failure.(1) Hypertension may be symptomless until the development of complications, but early diagnosis is essential to prevent and treat it.(2) While there are enormous amounts of health data to draw upon, the risk calculation for hypertension utilized today is usually rule-based direction and single-variable analysis that might miss interactions between several risk factors.(3) Furthermore, current prediction models also happen to be built upon pre-defined cutoffs that fail to respond to individual differences in variability and hence lead to poor predictive accuracy.(4) Whereas traditional machine learning models have been employed, they are challenging to handle in the case of high-dimensional data, feature selection of relevant features, and generalizability across more than one population.(5) Furthermore, most existing models are scalable, uninterpretable, and accurate for practical distribution.(6)
These restrictions are being diminished to make improvements in the forecasts of the risk of hypertension; it presents a new platform for machine learning that includes state-of-the-art methodologies like feature selection, ensemble techniques, and end-to-end examination. The strategy is intended to improve precision, flexibility, and detection power through the integration of different types of health elements like lifestyle, cholesterol, blood pressure, and BMI. Several measures will be employed to measure the performance of the model after training and evaluation on real health data. It becomes more possible to create a credible and more interpretable prediction model to assist medical practitioners in blood pressure prevention.
A prediction strategy based on medical screening parameters of hypertensive patients was suggested in the research.(7) It draws meaningful features from patients' physical examination using classification models, cross-validation, and recursive feature elimination. The model gave reasonable prediction outcomes with few features, with XGBoost performing the best. It advances the effects of hypertension. The aim of the research was to develop a recurrent vital hypertension risk estimation model, prospectively validated for the subsequent year.(8) A machine learning approach, XGBoost, was employed to develop the features selection and construction of the model. The model AUCs were 0,917 in the prospective and retrospective cohorts, correspondingly, and the majority of patients at high risk were old with chronic comorbid conditions.
Based on cardiovascular and respiratory data, the research aims to establish the effectiveness of several model-agnostic interpretation strategies of machine learning models for identifying persons at risk of developing hypertension.(9) To gain a better understanding and greater confidence in the results of the ML-based predictions, two local interpretability strategies, Shapley Value and Local Surrogate Models, as well as Feature Significance, Partial Dependency Plot, Individual Condition Anticipation, Feature Connection, and Global Substitute Models, represent the five global interpretability methodologies that have been used. The findings demonstrate that while global interpretations can help physicians comprehend the whole conditional distribution depicted by the trained response function, various interpretability strategies can provide distinct insights into the model behavior.
The research tried to develop diabetes and hypertension ML-based risk stratification programs for the risk population screened under low-resource settings by community-based screening programs.(10) RF approach outperformed US and UK risk scores by 13,5 % for hypertension and 35,5 % for diabetes, performing the best on prediction for the two conditions. Machine learning models were trained on and tested for 2278 patients' records in Hyderabad, India. According to the research, through improved risk classification, these programs will be able to use limited resources more efficiently with the help of machine learning programs.
The goal was to develop a simulation for the high-precision evaluation of coronary heart disease (CHD) using machine learning and massive data.(11) High-accuracy prediction models were obtained by applying distinct machine learning methods to the training dataset. The results were contrasted with established risk scales and conventional statistical techniques. It demonstrated that feature design greatly increased the precision of models and that machine-learning techniques performed better than conventional risk assessments.
Based on readily obtainable risk indicators, the investigation assessed and contrasted the effectiveness of four algorithms based on machine learning to predict the risk of hypertension.(12) Four models were used to identify the best hyper parameter values for the training set: RF, logistic regression (LR), and MLP neural networks, and CatBoost, which were optimized using 10-fold cross-validation. With a sensitivity (0,83), specificity (0,81), accuracy (0,82), and AUC (0,92), the RF method performed better than the other three distinct types, according to the experimental data.
The BP neural network-based risk of hypertension forecasting approach presented in the research was implemented on the Alibaba Cloud to offer a web application-style hypertension risk forecast service to individuals in the relevant locations.(13) The model's examination of risk factors for hypertension utilizing binary logistic regression provides inputs to it. The model can accurately assess the hazards of high blood pressure and provide a non-intrusive medical tool to provide prospective warning, according to the experimental data.
Aim of the research: to develop an Efficient Pelican Optimized Dynamic Random Forest (EPO-DRF) model that can forecast hypertension risk based on significant health indicators to aid in early detection and prevention. This model optimizing the selection of the appropriate variables increases prediction accuracy, facilitating improved healthcare.
METHOD
The Innovative Predictive Modelling for Hypertension Risk methodology starts with the Hypertension Risk Prediction Dataset, where data cleaning is applied to deal with missing values. This is followed by data pre-processing, which comprises min-max normalization to rescale the features. After this, hypertension risk is predicted using the EPO-DRF model for early prediction and prevention. The model's effectiveness is evaluated based on essential metrics to confirm accurate and efficient predictions. The proposed structure for predicting hypertension risk is displayed in figure 1.
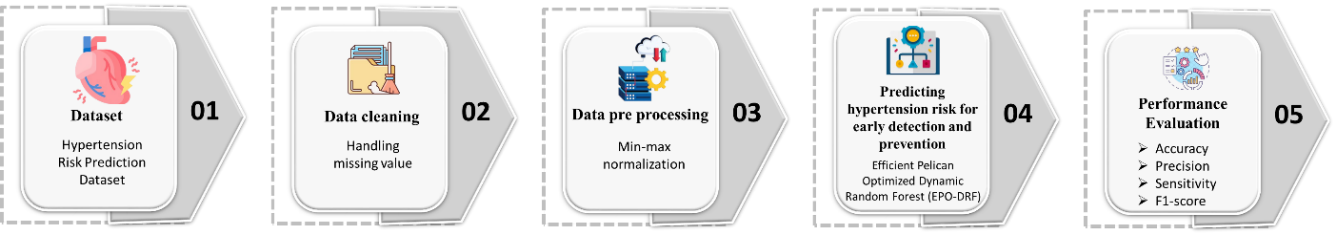
Figure 1. Framework of Hypertension Risk Prediction Using EPO-DRF Model
Dataset
The Hypertension Risk Prediction Dataset, from Kaggle [https://www.kaggle.com/datasets/ankushpanday1/hypertension-risk-prediction-dataset], contains information on different factors that affect the probability of heart attacks in young people in India, between 18 and 35 years. It includes clinical test results, lifestyle details, medical history, and demographic data. The chance of having a cardiovascular attack (yes/no) is the primary variable. This data is prepared to support machine learning use cases in investigations of socioeconomic or regional health disparities, risk prediction, public health, and dietary recommendations. Table 1 shows the hypertension risk data and health indicators for advanced predictive modeling.
|
Table 1. Hypertension risk data and health indicators for advanced predictive modeling |
||||||||
|
Age |
Gender |
Blood Pressure |
Cholesterol |
BMI |
Stress Level |
Resting Heart Rate |
Max Heart Rate |
Heart Attack Risk |
|
25 |
Male |
120/80 mmHg |
Normal |
22 |
High |
70 bpm |
190 bpm |
No |
|
30 |
Female |
140/90 mmHg |
High |
28 |
Moderate |
80 bpm |
175 bpm |
Yes |
|
33 |
Male |
160/100 mmHg |
Very High |
30 |
High |
85 bpm |
160 bpm |
Yes |
|
32 |
Female |
125/85 mmHg |
Normal |
24 |
Low |
75 bpm |
180 bpm |
No |
|
Fuente: https://www.kaggle.com/datasets/ankushpanday1/hypertension-risk-prediction-dataset |
||||||||
Hypertension is a strong risk factor for cardiovascular disease and stroke, while high cholesterol levels, particularly elevated LDL, increase the risk of heart disease. Body Mass Index (BMI) measures whether someone is overweight or obese, and this also increases the risk. Heart disease is caused by chronic stress, and an elevated resting heart rate tends to be a marker of greater cardiovascular risk.
Data cleaning using handling missing value
Missing data handling is essential to make precise predictions of hypertension risk. Missing values in patient records may occur as a result of patient non-responsiveness, errors during recording, or unreliable data collection. For preserving data integrity and model reliability, the right imputation methods are utilized:
Trivial (1 %): Treated with straightforward imputation methods like mean or median replacement. Manageable (1-5 %): Treated with forward or backward filling to ensure data integrity. Complex (5-15 %): Demands sophisticated techniques like multiple imputation strategies to replace missing values. Extremely heavy (>15 %): Demands advanced data recovery methods, such as predictive modeling-based imputation.
These approaches assist in maintaining the integrity of health indicators, like age, cholesterol, BMI, and blood pressure, to provide strong predictive modeling for hypertension risk.
Data Pre-processing using Min-max normalization
Min-max normalization is utilized to normalize clinical and lifestyle health measures so that they can represent the input for machine learning algorithms most optimally. It standardizes attributes such as blood pressure, cholesterol, blood glucose, and BMI to [0,1] to enhance the model's predictability. It uses the following equation (1):
![]()
Where u' is the perceived recorded value, u' is the average value of the health indicator, and minz and maxz are the dataset's minimum and maximum, respectively. Normalization here is used to avert biases from varying scales in the data and also to enhance the performance of the model in general.
Efficient Pelican Optimized Dynamic Random Forest (EPO-DRF)
The EPO-DRF is a hybrid model that uses the advantage of machine learning algorithms and optimization methods to maximize predictive capacity in the risk assessment for hypertension. The integration between the strong classification power of Random Forest and EPO is such that it facilitates the dynamic choice of the most relevant features, minimization of redundancies, and maximal model performance. Through prevention of over fitting, enhancing precision and recall, and dealing with unbalanced data more effectively, this combined strategy presents an effective method of accurately predicting the risk of hypertension based on the main health markers, such as age, blood glucose, cholesterol, and BMI.
Dynamic Random Forest (DRF)
Through enhanced correct classification and reduced spurious predictions, DRF is strengthened in evaluating risk for hypertension. RF models are good but require parameter tweaking for adjusting variability in health indicators and patient data in real time. The model adaptively identifies the optimal node-splitting attributes to enhance responsiveness in real time and prediction value in evaluating the risk of hypertension. Node split equations (2–3) are employed to determine the data Gain and Gini index when the patient set C is partitioned based on health indicators b.
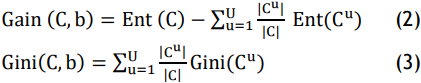
In this instance, Cu refers to the set of samples within C having numeric value cu related to a specific health parameter b.
![]()
Based on Equations (4–5), node splitting intends to optimize the clarity of labelled data following partitioning. Equation (6) presents the formula for dynamic parameter selection:
For the selection of features for hypertension risk prediction, α and β stand for weight coefficients. The lower G value guarantees an efficient feature selection process, improving predictive accuracy while preventing false classification. While optimizing detection accuracy and reducing false-positive rates in the diagnosis of hypertension, the flexible feature selection technique iteratively enhances criteria for decision-making, enabling real-time modification in medical risk assessment.
Efficient Pelican Optimizer (EPO)
The Pelican Optimization Algorithm (POA) is a new meta-heuristic optimization method based on pelican hunting behaviour. It has benefits like few adjustment parameters, fast convergence, and easy computation. With the improvement of the original POA, Hypertension risk forecasting techniques can be optimized significantly. The improvements proposed are elaborated as follows:
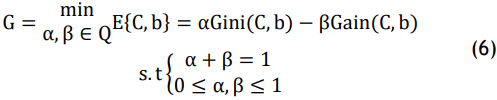
Initialization strategy: tent chaotic map is used to serve as an alternative to the typical random initialization in the standard POA for enabling predictive model parameter initialization. The introduction of the Tent chaotic mapping allows the initialization equation to be reformulated as follows in equations (7-8):
Where y∈(0,1), Tents∈[0,1], s=1,2,…,S, and s is the number of iterations that are currently occurring. S is the maximum number of iterations. At this point, the pelicans’ position is initiated by the Tent chaotic map, thus improving the POA algorithm’s global search capabilities for hypertension risk prediction based on health markers.
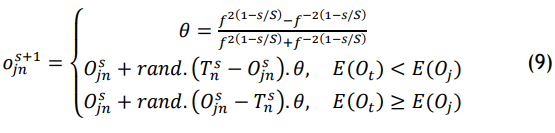
Converging towards the target (pre-hypertension threshold): in this phase, the pelican can continually modify its position with the help of the adaptive weighted factor. At the initial iteration, the factor has a large value so that the pelican can do a better global search. With iterations going forward, the factor drops adaptively so that the pelican can do a better local search, hence enhancing the speed of convergence to better predict the risks of hypertension. The expression for equation (9) is as follows:
Standard dataset containing a wide range of health indicators, including blood pressure, cholesterol, and BMI, was used to assess the validity of the EPOA for estimating the risk of hypertension.
Performance Evaluation
The tests were conducted on a machine featuring a 2,70 GHz processor and 116 GB RAM. Python version 3.8 was used to implement and test the model, using other pre-processing packages and machine learning libraries, like scikit-learn, to implement the EPO-DRF. The proposed EPO-DRF method outperformed existing methods, including Random Forest (RF),(14) Synthetic Minority Oversampling Technique (SMOTE),(15) artificial neural network (ANN),(15) and RF, as demonstrated through comparative analysis.
Accuracy and Sensitivity
The percentage of cases (true positives and true negatives) that are properly identified relative to all instances in the data set is known as accuracy. By displaying the percentage of accurate predictions, it provides a broad idea of the model’s quality.
Sensitivity measures how well the model can identify positive instances, or those who are at risk of having a heart attack or having high blood pressure. The model’s ability to identify true positives improves with sensitivity, which is crucial in situations involving health risk prediction. Hypertension risk models’ prediction sensitivity and accuracy are shown in figure 2 and table 2.
|
Table 2. Predictive Accuracy and Sensitivity in Hypertension Risk Models |
||
|
Models |
Accuracy (%) |
Sensitivity (%) |
|
RF(14) |
82,1 |
82,1 |
|
ANN(15) |
73,2 |
40,2 |
|
SMOTE(15) |
73,0 |
82,0 |
|
EPO-DRF (Proposed) |
90,4 |
87,5 |
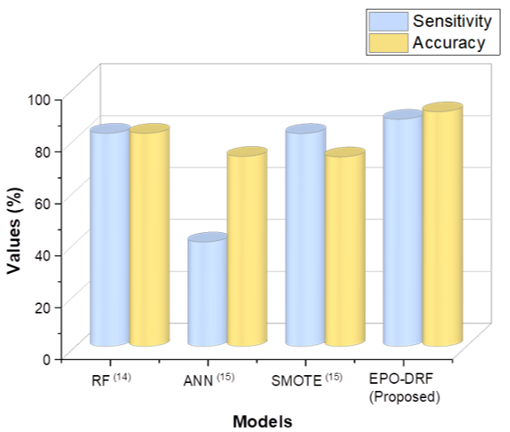
Figure 2. Performance Evaluation of Hypertension Risk Prediction Models
The EPO-DRF model illustrates 90,4 % accuracy, which is significantly outperforming prevailing approaches, like RF (82,1 %), ANN (73,2 %), and SMOTE (73,0 %). Furthermore, the model demonstrates 87,5 % sensitivity, surpassing the other approaches such as RF (82,1 %), ANN (40,2 %), and SMOTE (82,0 %), demonstrating its exceptional capacity to accurately identify people who are at risk of hypertension.
Precision and F1-score
Precision measures the proportion of precise positive forecasts the model generates. It is calculated by calculating the ratio of correctly predicted positive occurrences to the entirety of expected positive cases. When it comes to heart attack or hypertension risk prediction, it shows the proportion of those who were deemed to be at risk who are in fact at risk.
A score that stabilizes accuracy and recall is the F1 score, which is the harmonious median of the two. It is useful when the individual need to examine both false positives and false negatives. When predicting heart attacks or hypertension, a greater F1 score means that the model is doing better overall, particularly when the data is unbalanced. Figure 3 and table 3 exhibit the accuracy and F1-score values for predicting the risk of hypertension.
|
Table 3. Precision and F1-Score Outcome for Hypertension Risk Prediction |
||
|
Models |
Precision (%) |
F1-score (%) |
|
RF(14) |
81,4 |
81,6 |
|
ANN(15) |
57,8 |
47,4 |
|
SMOTE(15) |
73,0 |
77,0 |
|
EPO-DRF (Proposed) |
85,7 |
86,2 |
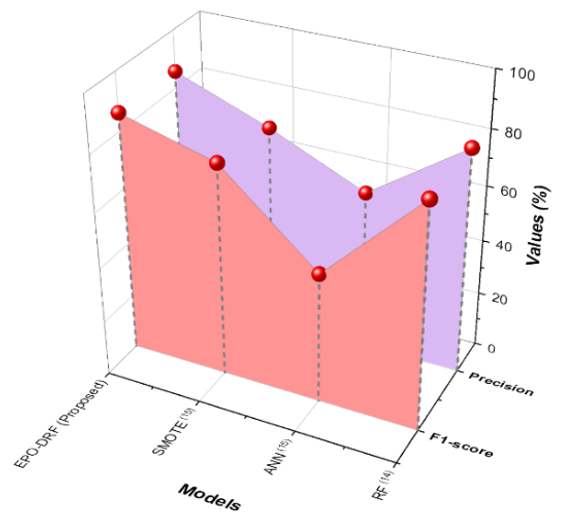
Figure 3. Evaluation Result Based on Hypertension Risk Factors
The EPO-DRF algorithm performs better than current approaches such as RF, ANN, and SMOTE both in precision and F1-score. RF (81,4 % precision, 81,6 % f1score), ANN (57,8 % precision, 47,4 % f1score), and SMOTE (73,0 % precision, 77,0 % f1score). The higher performance is evidence of its high capability for hypertension risk prediction with a good balance of class imbalances and maximizing precision and recall for health-related applications.
DISCUSSION
In terms of accurate prediction of hypertension risk, the existing methods, such as Random Forest (RF),(14) Synthetic Minority Oversampling Technique (SMOTE),(15) and Artificial Neural Networks (ANN),(15) are found to be relatively limited. RF(14) in spite of efficiency in the case of ensemble learning lacks efficiency in handling imbalanced datasets and the model's prediction of hypertension risk gets affected in the case of rare events. SMOTE(15) in spite of the benefit in handling class imbalance by the generation of the synthetic examples, gives rise to over fitting and poor generalization in the case of the small datasets. ANN(15) in spite of enormous adaptability, demands enormous datasets to train and is computationally expensive. It is also not interpretable, and so less useful in healthcare applications in which interpretability counts.
By contrast, the novel EPO-DRF algorithm overcomes the above limitations through dynamic optimization in the selection of the most discriminative features, imbalanced class handling, precision and recall. The algorithm, apart from the improvement in predictive precision, maintains interpretability and, as such, is a more reliable and practical tool in the hypertension diagnostic task in the early clinical applications.
CONCLUSIONS
Machine learning algorithms and health predictors are utilized to develop an advanced hypertension prediction model. This strategy greatly promotes health care analytics by making hypertension prediction, preventive care, and timely intervention easier and quicker, leading to improved patient outcomes and hypertension morbidity reduction. The suggested EPO-DRF model could classify hypertension at the early stage, exhibiting good performance in terms of high F1-score (86,2 %), accuracy (90,4 %), sensitivity (87,5 %), and precision (85,7 %). Through the minimization of redundant predictors and optimal selection, the model could recognize major hypertension risk predictors, leading to improved prediction.
Limitation and future scope
The research's reliance on medical records, which is inadequate to encompass all potential risk factors for hypertension, is one of its limitations. Future research may investigate the addition of more heterogeneous data sources, including genetic markers or real-time well-being monitoring, to further increase the predictive accuracy and utility of the model.
BIBLIOGRAPHIC REFERENCES
1. Zhou B, Perel P, Mensah GA, Ezzati M. Global epidemiology, health burden and effective interventions for elevated blood pressure and hypertension. Nature Reviews Cardiology. 2021 Nov;18(11):785-802.
2. Dzau VJ, Balatbat CA. Future of hypertension: The need for transformation. Hypertension. 2019 Sep;74(3):450-7.
3. Tago K, Takagi K, Jin Q. Detection of health abnormality considering latent factors inducing a disease. IEEE Access. 2020 Jul 27;8:139433-43.
4. Koshimizu H, Kojima R, Kario K, Okuno Y. Prediction of blood pressure variability using deep neural networks. International Journal of Medical Informatics. 2020 Apr1;136:104067.
5. Martinez-Ríos E, Montesinos L, Alfaro-Ponce M, Pecchia L. A review of machine learning in hypertension detection and blood pressure estimation based on clinical and physiological data. Biomedical Signal Processing and Control. 2021 Jul 1;68:102813.
6. Abdullah TA, Zahid MS, Ali W. A review of interpretable ML in healthcare: taxonomy, applications, challenges, and future directions. Symmetry. 2021 Dec 17;13(12):2439.
7. Chang W, Liu Y, Xiao Y, Yuan X, Xu X, Zhang S, Zhou S. A machine-learning-based prediction method for hypertension outcomes based on medical data. Diagnostics. 2019 Nov 7;9(4):178.
8. Ye C, Fu T, Hao S, Zhang Y, Wang O, Jin B, Xia M, Liu M, Zhou X, Wu Q, Guo Y. Prediction of incident hypertension within the next year: a prospective study using state wide electronic health records and machine learning. Journal of medical Internet research. 2018 Jan 30;20(1):e22.
9. Elshawi R, Al-Mallah MH, Sakr S. On the interpretability of machine learning-based model for predicting hypertension. BMC medical informatics and decision making. 2019 Dec;19:1-32.
10. Boutilier JJ, Chan TC, Ranjan M, Deo S. Risks tratification for early detection of diabetes and hypertension in resource-limited settings: machine learning analysis. Journal of medical Internet research. 2021 Jan 21;23(1):e20123.
11. Du Z, Yang Y, Zheng J, Li Q, Lin D, Li Y, Fan J, Cheng W, Chen XH, Cai Y. Accurate prediction of coronary heart disease for patients with hypertension from electronic health records with big data and machine-learning methods: model development and performance evaluation. JMIR medical informatics. 2020 Jul 6;8(7):e17257.
12. Zhao H, Zhang X, Xu Y, Gao L, Ma Z, Sun Y, Wang W. Predicting the risk of hypertension based on several easy-to-collect risk factors: a machine learning method. Frontiers in Public Health. 2021 Sep 24;9:619429.
13. Naushad SM, Hussain T, Indumathi B, Samreen K, Alrokayan SA, Kutala VK. Machine learning algorithm-based risk prediction model of coronary artery disease. Molecular biology reports. 2018 Oct;45(5):901-10.
14. AlKaabi LA, Ahmed LS, Al Attiyah MF, Abdel-Rahman ME. Predicting hypertension using machine learning: Findings from Qatar Biobank Study. Plos one. 2020 Oct 16;15(10):e0240370.
15. López-Martínez F, Núñez-Valdez ER, Crespo RG, García-Díaz V. An artificial neural network approach for predicting hypertension using NHANES data. Scientific Reports. 2020 Jun 30;10(1):10620.
FINANCING
No financing.
CONFLICT OF INTEREST
The authors declare that there is no conflict of interest.
AUTHORSHIP CONTRIBUTION
Data curation: Sujayaraj Samuel Jayakumar, Ved vrat verma, Udaybhanu Rout.
Methodology: Sujayaraj Samuel Jayakumar, Ved vrat verma, Udaybhanu Rout.
Software: Sujayaraj Samuel Jayakumar, Ved vrat verma, Udaybhanu Rout.
Drafting - original draft: Sujayaraj Samuel Jayakumar, Ved vrat verma, Udaybhanu Rout.
Writing - proofreading and editing: Sujayaraj Samuel Jayakumar, Ved vrat verma, Udaybhanu Rout.