doi: 10.56294/mw2024479
ORIGINAL
Effect of dietary characteristics on food consumption in humans
Efecto de las características de la dieta sobre el consumo de alimentos en humanos
Carolina de
La Torre Ibarra1 ![]() *
*
1Universidad de Guadalajara, Centro Universitario de Ciencias Biológicas y Agropecuarias. Guadalajara, México.
Cite as: De La Torre Ibarra C. Effect of dietary characteristics on food consumption in humans. Seminars in Medical Writing and Education. 2024; 3:479. https://doi.org/10.56294/mw2024479
Submitted: 05-10-2023 Revised: 03-02-2024 Accepted: 17-07-2024 Published: 18-07-2024
Editor: PhD.
Prof. Estela Morales Peralta ![]()
Corresponding author: Carolina de La Torre Ibarra *
ABSTRACT
The Specific Sensory Satiety Theory (SSST) has attempted to explain the mechanism of modification of self-regulatory behaviour (Hetherington & Rolls, 1996), proposing that subjects tend to consume a greater quantity of food when it has diverse sensory properties (varied diet). In contrast, subjects consume a smaller amount of food if it has similar sensory properties (monotonous diet). With regard to the effects of presenting diets with monotonous and varied sensory characteristics on humans, there are numerous studies that affirm that the availability of diverse foods is one of the factors that contribute to their overconsumption and, therefore, self-regulatory behaviours are not observed (McCrory, Fuss, McCallum, Yao, Vinken, Hays & Roberts, 1999; Rolls, 1985; Rolls, 2007). The main objective of this work was to experimentally evaluate the effect of foods with monotonous and varied sensory characteristics on food consumption in humans. To this end, three experiments were carried out: 1) Experiment 1: aimed to assess the consumption behaviour of monotonous and varied diets, presented in different sequences with intervals of approximately 23 hours between each presentation. Sixteen naïve experimental university students of both sexes, aged between 18 and 27, took part. The main results of Experiment 1 showed that the groups exposed to a single type of food presented a stable consumption. On the other hand, in the groups exposed to monotonous and varied foods, it was observed that the variety influenced the increase in consumption by the participants; Experiment 2: aimed to evaluate the effect of exposing the participants to monotonous or varied diets presented in different sequences with intervals of approximately 23 hours between each presentation. Sixteen naïve experimental university students of both sexes, aged between 18 and 27, took part; the main results showed that the groups exposed to the varied diet selected and consumed a greater quantity of food in comparison with the groups exposed to the monotonous diet, regardless of whether the food was provided simultaneously or successively. On the other hand, it was observed that the group exposed to monotonous foods simultaneously selected and consumed more foods than the group exposed to foods successively, while the group exposed to varied foods successively selected and consumed a greater quantity of foods in comparison to the group exposed to varied foods simultaneously. and, 3) Experiment 3: Experiment 2 was replicated with the following objectives: a) To evaluate the effects of exposing participants to monotonous or varied diets, simultaneously or successively, on consumption behaviour; and b) To identify the differences and/or similarities between the effects on the resulting behavioural parameters and the effects on the behavioural parameters observed in Experiment 2. Sixteen naïve experimental university students of both sexes, aged between 18 and 27, took part; the main results showed that the groups exposed to varied foods selected and consumed a greater quantity of food compared to the groups exposed to monotonous foods, regardless of whether the foods were provided simultaneously or successively. On the other hand, it was observed that the group exposed to monotonous foods simultaneously selected and consumed more portions than the group exposed to foods successively, while the group exposed to varied foods successively selected and consumed a greater number of portions compared to the group exposed to varied foods simultaneously.
Keywords: Sensory Specific Satiety; Varied Diet; Monotonous Diet; Food Consumption; Self-Regulatory Behaviour.
RESUMEN
La Teoría de la Saciedad Sensorial Específica (TSSE) ha intentado explicar el mecanismo de modificación de la conducta autorregulatoria (Hetherington & Rolls, 1996), proponiendo que los sujetos tienden a consumir una mayor cantidad de alimentos cuando éstos tienen propiedades sensoriales diversas (dieta variada). En contraparte, los sujetos consumen una cantidad menor de alimentos si estos tienen propiedades sensoriales similares (dieta monótona). Respecto a los efectos de presentar dietas con características sensoriales monótonas y variadas en humanos, existen numerosos estudios que afirman que la disponibilidad de alimentos diversos es uno de los factores que contribuyen al sobreconsumo de los mismos y por lo tanto, no se observan conductas autorregulatorias (McCrory, Fuss, McCallum, Yao, Vinken, Hays & Roberts, 1999; Rolls, 1985; Rolls, 2007). El objetivo principal de este trabajo se centró en evaluar experimentalmente el efecto de los alimentos con características sensoriales monótonas y variadas, sobre el consumo alimentario en humanos. Para ello, se realizaron 3 experimentos: 1) Experimento 1: tuvo el objetivo de valorar la conducta de consumo de dietas monótonas y variadas, presentadas en diferentes secuencias con intervalos de 23 horas aproximadamente entre cada presentación. Participaron 16 estudiantes universitarios voluntarios de ambos sexos, con edades comprendidas entre 18 y 27 años, ingenuos experimentalmente. Los principales resultados del Experimento 1 mostraron que los grupos expuestos a un solo tipo de alimentos, presentaron un consumo estable. Por otra parte, en los grupos expuestos a alimentos monótonos y variados, se observó que la variedad influyó en el incremento del consumo realizado por los participantes; Experimento2: tuvo como objetivo evaluar el efecto de exponer a los participantes a dietas monótonas o variadas presentadas en diferentes secuencias con intervalos de 23 horas aproximadamente entre cada presentación. Participaron 16 estudiantes universitarios voluntarios de ambos sexos, con edades comprendidas entre 18 y 27 años, ingenuos experimentalmente; los resultados principales mostraron que los grupos expuestos a la dieta variada, seleccionaron y consumieron una mayor cantidad de alimentos en comparación con los grupos expuestos a la dieta monótona, independientemente de si los alimentos fueron proporcionados de manera simultánea o manera sucesiva. Por otra parte, se observó que el grupo expuesto a alimentos monótonos de manera simultánea seleccionó y consumió más alimentos que el grupo expuesto a alimentos de manera sucesiva, mientras que, el grupo expuesto a alimentos variados de manera sucesiva seleccionó y consumió una cantidad mayor de alimentos en comparación al grupo expuesto a alimentos variados de manera simultánea. y, 3) Experimento 3: se replicó el Experimento 2 con los siguientes objetivos: a) Evaluar los efectos de exponer a los participantes a dietas monótonas o variadas, de manera simultánea o sucesiva, sobre la conducta de consumo; y, b) Identificar las diferencias y/o similitudes entre los efectos en los parámetros conductuales resultantes y los efectos en los parámetros conductuales observados en el Experimento 2. Participaron 16 estudiantes universitarios voluntarios de ambos sexos, con edades comprendidas entre 18 y 27 años, ingenuos experimentalmente; los resultados principales mostraron que los grupos expuestos a alimentos variados, seleccionaron y consumieron una cantidad mayor de alimentos en comparación a los grupos expuestos a alimentos monótonos, independientemente de si los alimentos fueron proporcionados de manera simultánea o manera sucesiva. Por otra parte, se observó que el grupo expuesto a alimentos monótonos de manera simultánea seleccionó y consumió más porciones que el grupo expuesto a alimentos de manera sucesiva, mientras que, el grupo expuesto a alimentos variados de manera sucesiva seleccionó y consumió un número mayor de porciones en comparación con el grupo expuesto a alimentos variados de manera simultánea.
Palabras clave: Saciedad Sensorial Específica; Dieta Variada; Dieta Monótona; Consumo Alimentario; Conducta Autorregulatoria.
INTRODUCTION
The first studies on eating behavior were conducted on animals, mainly rats, to explain the physiological aspects involved. The physiologist Pavlov (1927) carried out the most representative work on the association of physiological reactions (or conditioned reflex) with external stimuli, especially the studies on salivation and animals' anticipation of food. In this way, he contributed to psychology by proposing a theory based on using an objective method for studying the behavior of organisms, such as feeding.
Another important work was that of Richter (1947), who developed a series of studies that allowed him to point out that organisms carry out regulatory behaviors to maintain an internal balance (homeostasis) by counteracting certain adverse forces present in the environment. In this way, he was one of the first researchers to propose that behavior functions as another regulatory mechanism for feeding and modifying it by stating that diet selection is based on previous experiences or conditioning (p. 133).
Subsequently, studies of human eating behavior were related to food phenomena (such as hunger and satiety), concerned with homeostasis and other adaptive processes. The most representative study of this stage of analysis of the food phenomenon was that carried out by Cannon and Washburn (1912), whose proposal was that physiological responses could be modified by learning and experience with certain foods, marking a new path in the study of eating behavior (Capaldi, 1996). Since then, anthropology, sociology, and psychology have been interested in explaining this behavior and its relationship with the environment in which individuals develop (Rozin, 1995).
In psychology, attempts have been made to explain the effect of various factors on regulating food intake. However, most of these explanations are based on complex introspective or mentalistic arguments when understanding the eating phenomenon (Bolles, 1993; Capaldi, 1996; Rozin, 1995). An alternative to these explanations is the behavioral perspective, which highlights the role of learning and experience as facilitators in the acquisition and modification of self-regulatory behaviors essential to the organism, such as eating behavior, for example, the selection of foods, the initiation and termination of consumption, the amount of food that will be ingested, among others (Bolles, 1993; Booth, 1977; Ramsay, Seeley, Bolles & Woods, 1996; Rozin, 1995; Rozin & Kalat, 1971; Sclafani, 1997; Stunkard, 1975; Turró, 1912; Weingarten, 1993).
The Specific Sensory Satiety Theory (ST) (Hetherington, 1996; Hetherington & Rolls, 1996; Rolls, 1985; Rolls, 1993; Rolls, Rolls, Rowe & Sweeney, 1981; Rolls, Rowe, Rolls, Kingston, Megson & Gunary, 1981) has attempted to explain the mechanism of modification of self-regulatory behavior. This theory proposes that food's sensory characteristics significantly influence individuals' states of hunger and satiety. It has been observed that subjects tend to consume more food with diverse sensory properties (varied diets). On the other hand, subjects consume a smaller amount of food if it has similar sensory properties (monotonous diet). Various parameters of eating behavior have been identified and analyzed, including the effects of presenting diets with monotonous and varied sensory characteristics in humans. There are numerous studies (both in animals and humans) that affirm that the availability of diverse foods is one of the factors that contributes to their overconsumption and, therefore, self-regulatory behaviors are not observed (McCrory, Fuss, McCallum, Yao, Vinken, Hays & Roberts, 1999; Rolls, 1985; Rolls, 2007).
The studies mentioned evaluated the phenomenon of Specific Sensory Satiation (SSS) and its effects on individuals' behavior. However, some questions remain: Does the monotony or variety of food influence the latency, frequency, and sequence of food selection? Does the monotony or variety of food influence the quantity and duration of consumption by the individual? Moreover, finally, does exposure to food in a varied or monotonous diet, either successively or simultaneously, affect consumption behavior?
Based on these questions, the main objective of this work was to experimentally evaluate the effect of foods with monotonous and varied sensory characteristics on human food consumption.
Chapter 1 presents an analysis of different theoretical elements related to hunger, satiety and appetite, the TSSE, and the sensory characteristics of food. Chapter 2 presents the experimental proposal of this work, which gave rise to the experiments carried out. Chapter 3 includes the three experimental studies, indicating the method, the experimental design, the results, and the discussion for each. Finally, chapter 4 presents the conclusions obtained and a general discussion of the work.
METHOD
From the theoretical review, it was observed that studies on specific sensory satiety, monotony, and variety of food focus on the analysis of the perceptions provided by the participants of each study through questionnaires and other written reports (Guinard & Brun, 1998; Hetherington, 1996; Hetherington, Foster, Newman, Anderson & Norton, 2006; Hetherington & Rolls, 1996; Hetherington, Rolls & Burley, 1989; McCrory et al., 1999; Rolls, 1985; Rolls & McDermott, 1991; Rolls, Rolls, Rowe & Sweeney, 1981; Rolls, van Duijvenvoorde & Rolls, 1984; Smeets & Westerterp-Plantega, 2006; Snoek, Huntjens, van Gemert, de Graaf & Weenen, 2004), as well as in the amounts of food consumed, either in grams or calories (Guinard & Brun, 1998; McCrory et al., 1999; Rolls & McDermott, 1991; Rolls, Rolls, Rowe & Sweeney, 1981; Rolls, Rowe, Rolls, Kingston, Megson & Gunary, 1981; Rolls, van Duijvenvoorde & Rolls, 1984; Snoek, Huntjens, van Gemert, de Graaf & Weenen, 2004).
However, no studies were found that carried out a topographical analysis, which, according to Kazdin (2000), consists of the identification, measurement, and precise description of a particular behavior in terms of its frequency, intensity, and duration for a more precise measurement of the behavior, the quantity, latency, and rate of responses are recorded. In the analysis of eating behavior, a record will be made of the latency, frequency, and sequence of food selection, as well as the amount of food consumed and the duration of consumption by the participants. No studies have been found that evaluate these behavioral parameters about the consumption of varied foods.
In relation to the way in which food is presented in studies (e.g., Rolls et al., 1981), successive presentation of food is more appropriate than simultaneous presentation if the objective of the research is to evaluate the effect of variety on food consumption; however, this experimental condition has not been studied in combination with the aforementioned behavioral parameters.
On the other hand, the studies carried out using food products that are not considered food per se but rather sandwiches, snacks, or sweets (Hetherington, 1996; Hetherington, Foster, Newman, Anderson & Norton, 2006; Hetherington, Pirie & Nabb, 2002; Hetherington, Rolls & Burley, 1989; McCrory et al., 1999; Miller, Bell, Pelkman, Peters & Rolls, 2000; Rolls & McDermott, 1991; Rolls, Rolls, Rowe & Sweeney, 1981; Rolls, Rowe, Rolls, Kingston, Megson & Gunary, 1981). Few studies include more elaborate foods, that is, those with more than 2 or 3 ingredients, that require prior cooking and that are consumed in everyday life (Guinard & Brun, 1998; Rolls, Rowe & Rolls, 1982a; Rolls, Rowe, Rolls, Kingston, Megson & Gunary, 1981). Therefore, it is considered pertinent to design experimental studies that allow the simultaneous analysis of these variables, taking care of the characteristics of the food, as well as the type of diet, how it is presented, and the behavioral elements that will be analyzed, taking into account how they will be recorded and reported.
Therefore, the main objective of this work was to experimentally evaluate the effect of foods with monotonous and varied sensory characteristics on food consumption in humans, precisely the effect of providing monotonous and varied diets simultaneously and/or successively on the consumption behavior of individuals.
This thesis involved three experiments. The first was an exploratory experiment designed to study the behavior of the variables related to the type of diet (monotonous or varied) and the type of presentation (simultaneous or successive) and assess the relevance of the foods used.
Subsequently, two experiments were carried out to evaluate consumption behavior in the face of monotonous or varied foods. These experiments analyzed the quantity of food selected and consumed (in portions) and the latency and frequency of each participant when selecting and consuming the food provided, allowing for a more detailed analysis of consumption behavior.
It was also proposed to include foods with a more significant number of ingredients, which would require more time to prepare. These foods were similar to those commonly consumed by the participants in each experiment.
Finally, different experimental preparations were made so that some groups were exposed to monotonous or varied foods successively or simultaneously, with the aim of assessing the effects of presenting the diets under these experimental conditions. This could indicate whether there are significant differences in food consumption when people are exposed to similar situations in daily life.
Experiment 1
Based on the literature review, the following research questions were posed: What will happen if a monotonous diet is presented in two consecutive phases? Similarly, will consumption change if a varied diet is presented in both phases, with intervals of approximately 23 hours between them? On the other hand, what will happen if a varied diet is provided in the first phase and a monotonous diet in a later phase? Based on these questions, an exploratory experiment was planned to assess the consumption behavior of monotonous and varied diets presented in different sequences with intervals of approximately 23 hours between each presentation.
Method
Participants
Sixteen male and female volunteer students aged between 18 and 27 were naive to the experimental procedure. The participants were students at the School of Psychology at the Southern University Center of the University of Guadalajara.
Experimental situation
The experiments were carried out in cubicles in the human experimentation laboratory of the Center for Research in Eating Behavior and Nutrition (CICAN) at the Southern University Center. These spaces are approximately 3m by 3m and have adequate lighting and the necessary furniture for the study.
Devices and materials
Two Sony DSH-HC32 cameras with tripods were used to record the experimental sessions and subsequently analyze the behaviors observed. In addition, a computer system with the necessary programs for analyzing the videos and data obtained was used.
The food provided was sandwiches with different ingredients, which were classified according to the type of diet: a) Monotonous diet: ham and American cheese sandwiches and, b) Varied diet: 1) ham and American cheese sandwiches; 2) grilled chicken sandwiches with onion, tomato, and lettuce; 3) salad sandwiches containing vegetables such as carrots, lettuce, tomato, and onion; 4) brown bread sandwiches with lettuce, tomato, and onion; and 5) strawberry jam sandwiches. The sandwiches (except the strawberry jam sandwich) were dressed with cream, mustard sauce, a little ground pepper, and salt. Each participant was given 250 milliliters of orange-flavored water to drink. The following table shows the calorie content of each of the foods (table 1).
|
Table 1. Calorie content of each food |
|
|
Food |
Calories |
|
Ham and cheese sandwich |
251,5 kcal |
|
Grilled chicken sandwich |
266,5 kcal |
|
Salad sandwich |
215,5 kcal |
|
Brown sugar sandwich |
280,8 kcal |
|
Jam sandwich |
176 kcal |
|
Orange-flavored water |
45kcal |
Procedure
1. Sample selection: Authorization to carry out the study was first requested from the institution once its objective had been explained. Subsequently, the psychology department was visited to invite students to participate voluntarily in the study. Those participants who agreed to participate received an extra point in a subject. Once the sample had been constituted, an informed consent and commitment letter was provided to each of the students, as well as a summons specifying the study's date, time, and location.
2. Formation of the experimental groups: The participants were randomly assigned to one of the 4 experimental groups and given their summons. They were asked to attend their appointment after fasting for approximately 4 to 5 hours.
3. Conduct of the experiment: Once the participants were at the study site, they were told they could consume as much food as they wanted until they felt full. Subsequently, the food was provided successively in 5 intervals of 5 minutes each. Food was provided, and after 5 minutes, it was changed to a different food. Once Experimental Phase 1 was finished, the leftovers of each participant were counted and recorded. This experimental procedure was carried out the following day (Phase 2).
4. Data recording and analysis: The measures used in the data analysis were portion consumption and calorie consumption. In order to facilitate the data analysis, some records of the behavior to be evaluated were made during the experimental phases. The main thing recorded was the number of portions consumed by each participant. The experimental phases were video-recorded for analysis at a later stage. The calories were calculated according to the portions consumed in the monotonous diet. The consumption of portions was calculated by adding up the portions eaten during the experimental phases. The consumption of calories was calculated by multiplying the number of calories in each sandwich by the number of portions eaten. As for the consumption of calories in the varied diet, the calories corresponding to each portion eaten were added. In the data analysis, the average consumption (in portions and calories) in the initial interval was compared with the average consumption (in portions and calories) in the final interval of each phase within each group. In addition, a comparison of food consumption (in portions and calories) between the groups was made. The data analysis and its graphing was done using Microsoft Excel 2010 for Windows.
Experimental design
Four experimental groups were formed, with four participants (two men and two women). The participants were randomly assigned to the groups, and each group was named according to the experimental conditions to which they were exposed. Group 1 was exposed to a monotonous diet. Group 2 was exposed to a varied diet. Groups 3 and 4 were exposed to both types of diet.
The experiment was carried out in 2 phases, each lasting approximately 30 minutes. Each phase, in turn, consisted of 5 intervals, each lasting 5 minutes. Between each phase, there were approximately 19 hours and 30 minutes.
In each interval, they were provided with a plate with two portions, equivalent to a sandwich. At the end of each interval, 2 of the researchers entered the room, removed the plate, and placed a new one with another two portions until five deliveries were completed. Recordings were made, and food consumption was recorded according to the design in table 2.
|
Table 2. Design of Experiment 1 |
|||||
|
|
Deprivation |
Phase 1 |
Interval between experimental phases |
Deprivation |
Phase 2 |
|
Group 1 |
Without consumption of experimental foods |
Monotony |
Free access to experimental foods |
Without consumption of experimental foods |
Monotony |
|
Group 2 |
Without consumption of experimental foods |
Variety |
Free access to experimental foods |
Without consumption of experimental foods |
Variety |
|
Group 3 |
Without consumption of experimental foods |
Monotony |
Free access to experimental foods |
Without consumption of experimental foods |
Variety |
|
Group 4 |
Without consumption of experimental foods |
Variety |
Free access to experimental foods |
Without consumption of experimental foods |
Monotony |
|
Duration |
4 to 5 hours |
5 intervals of 5 minutes each |
7:30 p.m. |
4 to 5 hours |
5 intervals of 5 minutes each |
It shows the design of Experiment 1, indicating the conditions to which each experimental group was exposed, the duration of each condition, and the differences established for each group.
Results
The results obtained in Experiment 1 are described below. In the first section, an intragroup and intergroup analysis was carried out of the average food consumption—expressed in portions—shown in each phase's initial and final intervals. Subsequently, in the second section, an intragroup and intergroup analysis was carried out of the average food consumption—expressed in calories—shown in the initial and final intervals of each Phase.
Portions consumed:
Figure 1 shows the participants' average food consumption in portions in the four groups evaluated. It shows the average consumption of the participants in the initial (1) and final (5) intervals during Phases 1 and 2. The top part of each graph shows the group number and the corresponding experimental condition. The Phase corresponding to the consumption made is indicated at the bottom of each graph. The white bar indicates the consumption made during Interval 1. The black bar indicates the consumption made during Interval 5.
As can be seen, Group 1, which was exposed to a monotonous diet in both phases, consumed 0,75 servings in the final interval, which is approximately 50 % less than the initial interval. The results are similar in both experimental phases.
On the other hand, Group 2 (variety-variety) increased its consumption from interval 1 to interval five during Phase 1 (from 1 portion to 1,5 portions). Similarly, when comparing the results between phases, an increase in consumption was observed during both intervals of Phase 2. The group consumed .50 more servings during interval 1 of Phase 2, compared to Phase 1, and increased consumption by .50 more servings towards interval 5 of Phase 2.
About Group 3 (monotony variety), it was observed that food consumption decreased from the initial interval (1) from 1 portion to less than 0,25 portions in the final interval (5) during exposure to the monotony condition (Phase 1). On the other hand, during the variety condition (Phase 2), the average consumption in the initial interval was 1,70 portions. In the final interval, it was approximately 1,75 portions, so consumption remained stable. Regarding consumption between phases by this group, it was observed that the consumption of portions was higher during the variety condition compared to the monotony condition.
Finally, Group 4, exposed to variety-monotony, presented a consumption of 2 portions during interval one and approximately 1,75 portions during interval 5 of the variety condition (Phase 1). On the other hand, consumption of the monotonous diet decreased in the final interval (Phase 2), with a consumption of approximately 1,75 servings during interval one and approximately 0,75 servings during interval 5. This indicates that the participants consumed 1 serving less during interval 5, compared to interval 1.
Figure 1. Shows the average consumption of portions by the 4 Groups in intervals 1 and 5, during Phases 1 and 2. The top of each graph indicates the group number and the corresponding experimental condition. The white bar indicates consumption during Interval 1. The black bar indicates consumption during Interval 5.
Figure 2 shows the average total consumption in portions. It shows the participants' consumption in the four groups during Phases 1 and 2, represented by the black and white columns. The group number and the experimental condition corresponding to each one are indicated at the bottom of the graph.
This figure shows that groups 1 and 2 increased their consumption during Phase 2; consumption was approximately 5,5 servings during interval 1 and approximately seven servings during interval 5. On the other hand, Group 3 doubled its consumption of servings once it changed from a monotonous diet to a varied diet. Average consumption during Phase 1 was four servings, while average consumption during Phase 2 was eight. Group 4 had an average consumption of 8 servings during the variety condition (Phase 1), while in the monotony condition (Phase 2), consumption was around 7. This indicates a decrease of 1 portion in the group's average consumption.
Calories (kcal) consumed
Figure 3 shows the average consumption of calories by the participants in each of the four groups evaluated. It shows the average consumption of the participants in the initial (1) and final (5) intervals during Phases 1 and 2. The group number and the corresponding experimental condition are at the top of each graph. The phase corresponding to the consumption is indicated at the bottom of each graph. The white bar indicates the consumption during Interval 1. The black bar indicates the consumption during Interval 5.
It can be seen that Group 1, which was exposed to a monotonous diet in both phases, consumed approximately 180 calories during interval 1 of Phase 1. In contrast, in the final interval, it consumed 100 calories. This indicates that calorie consumption decreased, with 80 fewer calories in the final interval. Regarding Phase 2, the group consumed 200 calories in the initial interval, and the number of calories consumed during the final interval was 100, indicating that calorie consumption decreased by 50 %.
On the other hand, Group 2 (variety-variety) consumed 140 calories during interval 1 and 150 calories in interval 5, indicating an increase of 10 calories in consumption. During Phase 2, there was also an increase of 15 calories in consumption between intervals 1 and 5.
About Group 3 (monotony variety), 135 calories were consumed in interval 1 in the monotony condition (Phase 1), while in interval 5, consumption was 20. This indicates the group consumed 115 fewer calories during interval five than interval 1. On the other hand, in the variety condition (Phase 2), there was a consumption of 200 calories in the initial interval (1) and 150 calories in the final interval (5). This indicates that consumption decreased by 25 % (50 kcal) towards the final interval. On the other hand, it can be seen that calorie consumption was higher in the variety condition (Phase 2) than in the monotony condition (Phase 1).
Finally, Group 4, exposed to variety-monotony, consumed 250 calories in interval one and decreased calorie consumption to 150 during interval 5 of Phase 1. This indicates a decrease of 100 calories, equivalent to 40 % of the consumption during interval 1. About Phase 2, in interval 1, the group consumed 225 calories, and in interval 5, consumption decreased to 100 calories, which indicates a decrease of approximately 55 % in calorie consumption.
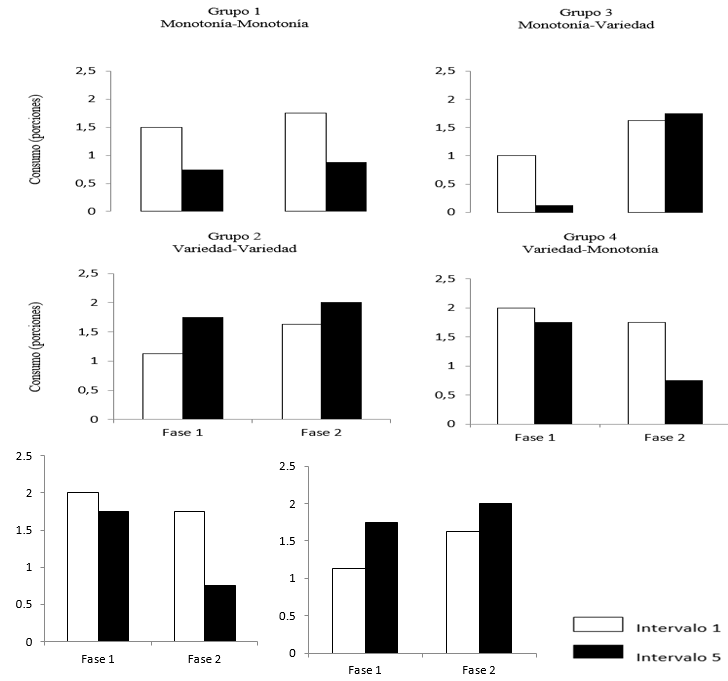
Figure 1. Average consumption in portions of the groups in both phases in the initial and final intervals
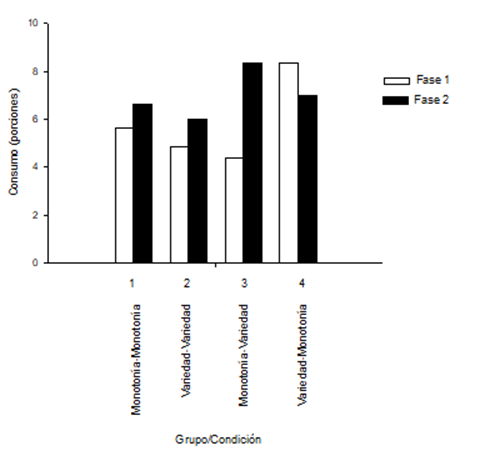
Figure 2. Average consumption of portions by the 4 groups during the experimental phases
Figure 2. Shows the average total consumption of portions by the four groups during Phases 1 and 2. The group number and the experimental condition corresponding to each one are indicated at the bottom of the graph. The white bar indicates consumption during Phase 1. The black bar indicates consumption during Phase 2.
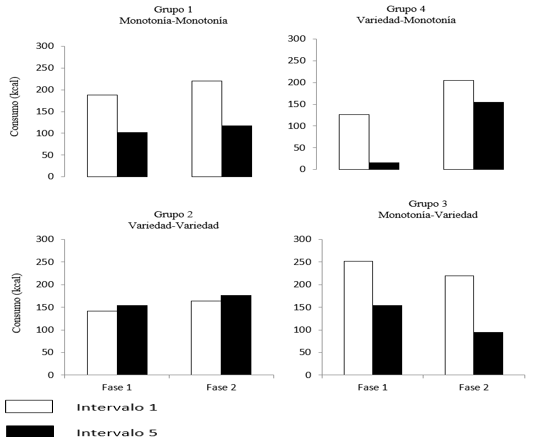
Figure 3. Average calorie consumption of the 4 groups in both phases during the initial and final
Figure 3. Shows the average calorie consumption of the 4 Groups in intervals 1 and 5, during Phases 1 and 2. The top of each graph shows the group number and the experimental condition corresponding to each one. The white bar indicates consumption during Interval 1. The black bar indicates consumption during Interval 5.
Figure 4 shows the average total calorie consumption by the four groups in Phase 1 and Phase 2, represented by the white and black columns, respectively. The group number and the experimental condition corresponding to each are indicated at the bottom of the graph.
It can be seen that the consumption of Group 1 increased from 700 to 900 calories approximately in Phase 1. Group 2 increased its consumption from 500 to 680 calories towards Phase 2, in the same way that the consumption of portions increased. On the other hand, Group 3 (monotony-variety) increased the number of calories consumed from 500 to 1000 calories by changing the monotonous diet for a varied diet, which indicates a doubling of the calories consumed during Phase 2, compared to Phase 1. In Group 4 (variety-monotony), calorie consumption was lower in Phase 2 compared to Phase 1 (1000 and 950 calories, respectively). This indicates a decrease of approximately 50 calories in the group's average calorie consumption.
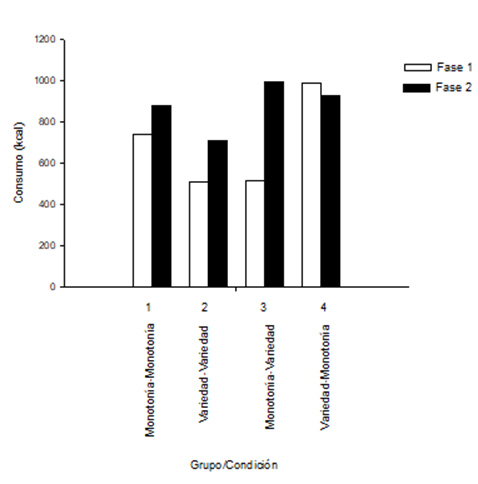
Figure 4. Average calorie consumption of the 4 groups during the experimental phases
Figure 4. Shows the average total calorie consumption of the four groups during Phases 1 and 2. The group number and the experimental condition corresponding to each group are indicated at the bottom of the graph. The white bar indicates consumption during Phase 1. The black bar indicates consumption during Phase 2.
Discussion
The main results of Experiment 1 showed that the monotony-monotony and variety-variety groups showed similar consumption trends in both experimental phases. On the other hand, in the monotony-variety and variety-monotony groups, variety influenced the participants' increase in consumption.
About the sameness-sameness group, it was observed that the participants, when exposed to a diet with identical sensory characteristics, decreased their consumption (both in quantity and caloric content) within each experimental phase. This indicates that the effects of the SSE occurred in a single meal. This is in line with the proposal of Rolls and his collaborators (1981), who pointed out that it is easier for individuals to develop SSE when they are exposed to a monotonous diet in a single meal (Hetherington & Rolls, 1996; Meiselman, 1996; Rolls, 1993).
In addition, our study observed that when the participants were exposed to the same diet in both phases, their consumption of food and calories increased in the second phase compared with the first. This effect occurred independently of the diet provided (monotonous or varied).
Indeed, this study did not conduct several phases that would involve a longer or more extended period; however, conducting two experimental phases made it possible to outline a constant trend in the exposure to a specific type of diet.
About these data, Meiselman (1996), Raynor and Epstein (2001), and Rolls (1993) pointed out that there are also long-term effects related to palatability that persist from meal to meal. In the case of foods with similar sensory characteristics, a state of monotony is provoked. In the case of varied diets, these promote the search for, selection, and consumption of foods with different sensory characteristics that stimulate the palate, as well as the fulfillment of the caloric intake required for each organism, in addition to causing a higher food intake.
This last effect was observed in our study, as Group 2 (variety-variety), which was exposed to foods with different sensory properties, showed an increase in the consumption of both portions and calories during exposure to the diet in each of the experimental phases.
In contrast, Group 1, which was exposed to a monotonous diet, showed no changes in the consumption of portions and calories, so it can be assumed that in the long term, no changes in consumption would be observed. Another assumption could be that the participants did not get used to the diet, as consumption would have been expected to decrease in the second phase, given the repeated exposure (Hetherington, Pirie & Nabb, 2002; Miller, Bell, Pelkman, Peters & Rolls, 2000; Raynor & Epstein, 2001; Rolls & de Waal, 1985).
On the other hand, in the monotony-variety and variety-monotony groups, it was observed that food consumption was higher during exposure to the varied diet and was maintained throughout the experimental phase. In comparison, consumption of the monotonous diet was lower and decreased towards the end of each experimental phase. These data align with those reported by other authors, who pointed out that the greater the variety of ingredients that make up a diet (provided successively), the greater the response regarding consumption, and the appetite will be maintained for a more extended period. On the contrary, the amount of food consumed in a first interval will decrease considerably in subsequent intervals (Hetherington, 1996; Meiselman, 1996; Raynor & Epstein, 2001; Rolls, 1985; Rolls, 1993; Rolls, Rolls, Rowe & Sweeney, 1981; Rolls, Rowe, Rolls, Kingston, Megson & Gunary, 1981; Rolls, Rowe & Rolls, 1982a; Rolls, Rowe & Rolls, 1982b).
Finally, figures 3 and 4 show results similar to those reported in figures 1 and 2. This indicates that the food consumption pattern evaluated by the number of portions consumed and the number of calories ingested will show similar consumption trends as long as the caloric content of the food per portion is controlled.
Based on the data obtained in this experiment, two additional experiments were carried out with the following modifications: 1) the number of experimental sessions was increased, exposing the participants to foods with similar or varied sensory characteristics in order to observe their effects; 2) experiments were carried out comparing the effects of exposing the participants to diets simultaneously or successively; 3) finally, participants were exposed to an open-access situation with indefinite periods for consumption, which allowed for the evaluation of latency, both in the selection and consumption of food, as well as the amount of food selected and the amount of food consumed by each participant, in addition to the frequency and sequence of food selection.
Experiment 2
Based on the results obtained in Experiment 1, the following research question emerged: What effects can be observed in behavioral parameters when participants are exposed to a monotonous or varied diet successively or simultaneously over several experimental sessions?
Studies in the literature on SSE reported that exposure to food simultaneously in a meal causes greater consumption than when food is provided successively (Raynor & Epstein, 2001; Rolls, Rowe, Rolls, Kingston, Megson & Gunary, 1981).
Based on this information, a second experiment was proposed in which how the diets were presented would be manipulated. Therefore, this experiment evaluated the effects of exposing participants to monotonous or varied diets, simultaneously or successively, on consumption behavior.
Method
Participants
Sixteen volunteer students of both sexes, aged between 18 and 27, were experimentally naive. The participants were students at the School of Psychology at the Southern University Center of the University of Guadalajara.
Experimental situation
The experiments were carried out in cubicles in the human experimentation laboratory of the Center for Research in Eating Behavior and Nutrition (CICAN) at the Southern University Center. These spaces are approximately 3m by 3m and have adequate lighting and the necessary furniture for the study.
Devices and materials
Two Sony DSH-HC32 cameras with tripods were used to record the experimental sessions and subsequently analyze the behaviors observed. In addition, a computer system with the necessary programs for analyzing the videos and data obtained was used.
The food provided was sandwiched with different ingredients, which were classified according to the type of diet: a) Monotonous diet: ham and American cheese sandwiches and, b) Varied diet: 1) ham and American cheese sandwiches; 2) grilled chicken sandwiches with onion, tomato, and lettuce; 3) brown sugar sandwiches with lettuce, tomato, and onion; and 4) strawberry jam sandwiches. The sandwiches (except the strawberry jam sandwich) were dressed with cream, mustard sauce, a little ground pepper, and salt. The portion in this experiment corresponded to half a sandwich; therefore, each sandwich is equivalent to 2 portions. Each participant was given 250 milliliters of orange-flavored water to drink. The following table shows the caloric content of each of the foods (table 3).
|
Table 3. Calorie content of each food |
|
|
Food |
Calories |
|
Ham and cheese sandwich |
251,5 kcal |
|
Grilled chicken sandwich |
266,5 kcal |
|
Brown sugar sandwich |
280,8 kcal |
|
Jam sandwich |
176 kcal |
|
Orange-flavored water |
45 kcal |
|
Source: The number of calories per food was determined based on the Mexican System of Equivalent Foods (Marván, Pérez & Palacios, 2004) |
|
Procedure
1. Sample selection: Authorization to carry out the study was first requested from the institution once its objective had been explained. Subsequently, the psychology classrooms were visited to invite students to participate voluntarily in the study. Those students who agreed to participate received an extra point in a subject. Once the sample had been constituted, each student was provided with informed consent, a letter of commitment, and a summons specifying the study's date, time, and location.
2. Formation of the experimental groups: The participants were randomly assigned to one of the four experimental groups and given their summons. They were asked to attend their appointment after going without food for approximately 4 to 5 hours.
3. Conduct of the experiment: Once the participants were at the study site, they were told they could consume whatever food they wanted until they felt satisfied.
4. Data recording and analysis: The measures used in the data analysis for the groups that were exposed simultaneously were the number of portions selected and the number of portions consumed, selection latency and consumption latency, and the frequency and sequence of selection. In the groups exposed successively, the variables of the number of portions selected and several portions consumed, selection latency and consumption latency, and the frequency of selection were evaluated. To facilitate the analysis of these variables, some records were made during the experimental sessions, mainly the number of portions consumed by each participant, and the experimental sessions were videotaped. The consumption of portions was calculated by adding up the portions eaten during the experimental sessions. In the data analysis, the total number of portions selected and the total number of portions consumed by each participant in each group for the four study sessions were recorded. In addition, the latency of selection and consumption of the portions and the sequence and selection frequency were analyzed. The data was analyzed and graphed using Microsoft Excel 2010 for Windows.
Experimental design
Four experimental groups were formed, with four participants (two men and two women). The participants were assigned to the groups at random.
Groups 1 and 3 were exposed to the foods simultaneously. For these groups, the experiment was carried out in four experimental sessions lasting approximately 30 minutes each. The foods were placed on four trays or plates numbered 1 to 4 simultaneously, and after 30 minutes, they were removed. Participants were instructed to consume the food until they were satisfied.
Groups 2 and 4 were exposed to the food in succession, and the experiment was carried out in 4 experimental sessions. Each session was made up of four intervals, each lasting eight minutes. In each interval, they were provided with a plate with two portions, equivalent to a sandwich. At the end of each interval, two researchers entered the room, removed the plate, and placed a new one with another two portions until four deliveries had been made.
In the four experimental sessions, groups 1 and 2 had access to monotonous foods, while groups 3 and 4 were exposed to varied foods. Recordings were made, and food consumption was recorded according to the design in figure 5.
Results
The results obtained in Experiment 2 are described below. Initially, an intragroup analysis was carried out of the number of portions selected and consumed portions, selection latency and consumption latency, and frequency and sequence of selection (for the groups that were exposed to the foods simultaneously). Similarly, the variables of number of portions selected and number of portions consumed, selection latency and consumption latency, and the frequency of selection (for the groups that were exposed to the foods successively) were analyzed. Subsequently, an intergroup analysis was carried out on the selection and consumption of portions and a comparison between the selection and consumption of food in the four experimental groups during the four experimental sessions.
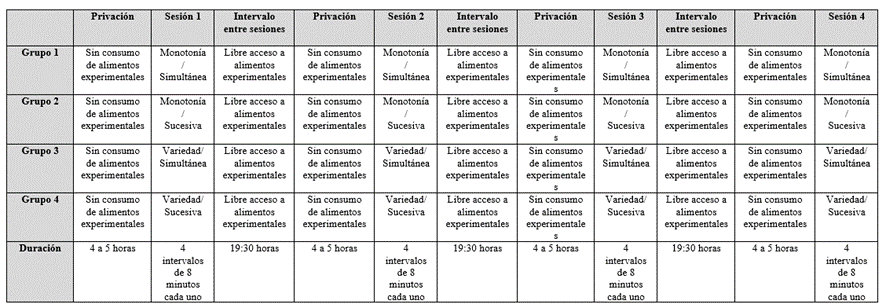
Figure 5. Design of Experiment 2
It shows the design of Experiment 2, indicating the conditions to which each experimental group was exposed, the duration of each condition, and the differences established for each group.
Selection. Intra-group analysis:
Figure 6 shows the selection made by Group 1 (simultaneous monotony) during the four experimental sessions. The experimental session in which each selection was made is indicated at the bottom of the graph. The vertical axis indicates the number of portions selected. To the figure's left is the number of participants and the color corresponding to each one. Participant 1 is represented in white, Participant 2 in black, Participant 3 in gray, and Participant 4 with a black and white striped column. It can be seen that 2 of the 4 participants selected a smaller number of portions (approximately 66 %) compared to the remaining 2, who made similar selections throughout the experiment (5 or 6 portions in each experimental session). The results were similar in the four experimental sessions.
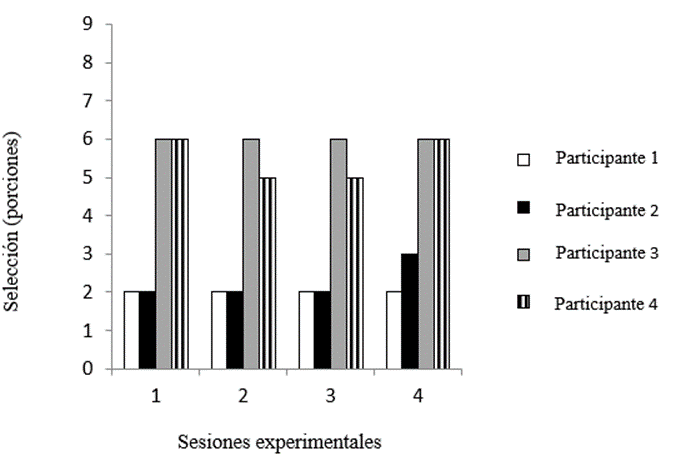
Figure 6. Total number of portions selected by each participant in the 4 experimental sessions
Figure 6. Shows the total selection of portions made by each participant in the group exposed to monotonous foods simultaneously during the four experimental sessions. The experimental session in which each selection was made is indicated at the bottom of the graph. The vertical axis shows the number of portions selected. The number of participants and the corresponding color are displayed on the figure's left.
Figure 7 shows the selection made by Group 2 (successive monotony). The experimental session in which each selection was made is indicated at the bottom of the graph. The vertical axis shows the number of portions selected. To the figure's left is the number of participants and the corresponding color for each. Participant 1 is represented in white, Participant 2 in black, Participant 3 in gray, and Participant 4 with a black and white striped column. It was observed that the selection of portions made by the group oscillated between 3 and 4 portions during the four experimental sessions, except for Participant 3, who decreased the number of portions selected to 1 during the second experimental session and two portions during the fourth experimental session.
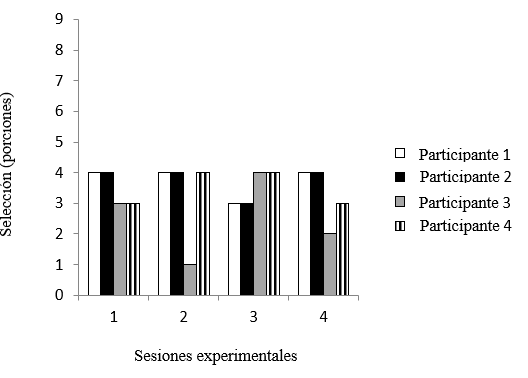
Figure 7. Total number of portions selected by each participant in the 4 experimental sessions
Figure 7. Shows the total selection of portions made by each participant in the group exposed to monotonous foods successively during the four experimental sessions. The experimental session in which each selection was made is indicated at the bottom of the graph. The vertical axis shows the number of portions selected. The number of participants and the corresponding color are displayed on the figure's left.
Figure 8 shows the food selection made by Group 3 (simultaneous variety). The experimental session in which each selection was made is indicated at the bottom of the graph. The vertical axis shows the number of portions selected. The number of participants and the color corresponding to each one are displayed on the figure's left. Participant 1 is represented in white, Participant 2 in black, Participant 3 in gray, and Participant 4 with a black and white striped column. In general, it was observed that the group maintained or increased the number of portions selected during experimental session two compared to experimental session 1. In the cases that showed an increase, this was from 1 to 2 portions more than those chosen during the first experimental session, with the selection ranging between 6 and 8 portions. In the cases where the selection was similar to that of the first session, it ranged between 4 and 6 servings. On the other hand, in most cases, the number of servings selected during session 4 decreased by approximately 50 % compared to experimental session 2; that is, the selection of servings ranged between 2 and 3 servings in most cases.
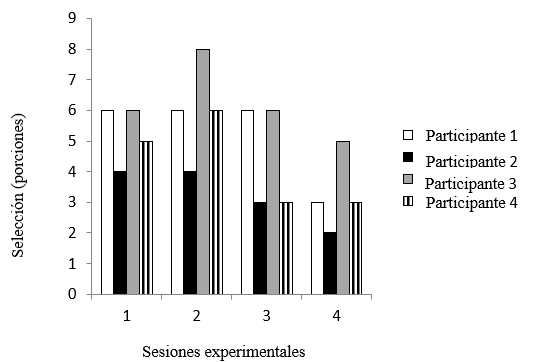
Figure 8. Total number of portions selected by each participant in the 4 experimental sessions
Figure 8. Shows the total selection of portions made by each participant in the group exposed to varied foods simultaneously during the four experimental sessions. The experimental session in which each selection was made is indicated at the bottom of the graph. The vertical axis shows the number of portions selected. The number of participants and the corresponding color are displayed on the figure's left.
Figure 9 shows the total selection of portions made by the group exposed to varied foods in succession during the four experimental sessions. The experimental session in which each selection was made is indicated at the bottom of the graph. The vertical axis shows the number of portions selected. The number of participants and the color corresponding to each is shown on the left of the figure. Participant 1 is represented in white, Participant 2 is in black, Participant 3 is in gray, and Participant 4 has a column striped in black and white. This group observed a similar selection in experimental sessions 1 and 3 and 2 and 4. In session 2, in some cases, the number of portions selected increased by approximately 33 % (2 portions); in other cases, the increase in the number of chosen portions during experimental session 1 was more significant than 100 % (3 portions). These data were similar to those observed in experimental session 4, in which the group in general increased the number of servings selected (2 or 3 servings) compared to experimental session 1.
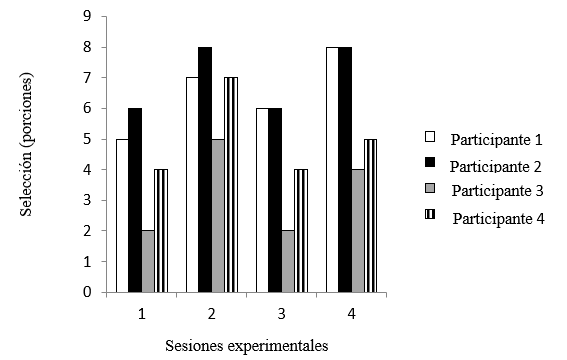
Figure 9. Total number of portions selected by each participant in the 4 experimental sessions
Figure 9. It shows the total selection of portions made by each participant in the group who was successively exposed to varied foods during the four experimental sessions. The experimental session in which each selection was made is indicated at the bottom of the graph. The vertical axis shows the number of portions selected. The number of participants and the corresponding color are displayed on the figure's left.
Consumption. Intra-group analysis
Figure 10 shows the total consumption of portions by each participant in the group exposed to monotonous foods simultaneously during the four experimental sessions. The lower part of the graph indicates the experimental session in which each consumption took place. The vertical axis indicates the number of portions consumed. The figure shows the number of participants on the left and the color corresponding to each one. Participant 1 is represented in white, Participant 2 is in black, Participant 3 is in gray, and Participant 4 has a column striped in black and white. It was observed that the consumption of monotonous foods by Group 1 (simultaneous monotony) was similar during the four experimental sessions. It was observed that participants 1 and 2 consumed a smaller amount of food (3 or 4 portions less) compared to participants 3 and 4 (5 to 6 portions consumed) during the four experimental sessions.
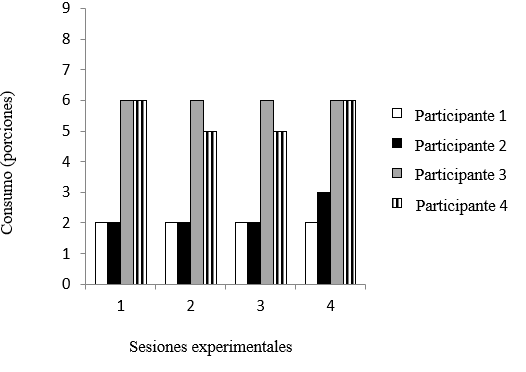
Figure 10. Total consumption of portions during the 4 sessions
Figure 10. Shows the total consumption of portions by each participant in the group exposed to monotonous foods simultaneously during the four experimental sessions. The experimental session in which each consumption was made is indicated at the bottom of the graph. The vertical axis shows the number of portions consumed. The number of participants and the corresponding color are displayed on the figure's left.
Figure 11 shows the consumption by Group 2 (successive monotony). The experimental session where each consumption occurred is indicated at the bottom of the graph. The vertical axis shows the number of servings consumed. The number of participants and the corresponding color are displayed on the figure's left. Participant 1 is represented in white, Participant 2 is in black, Participant 3 is in gray, and Participant 4 has a column striped in black and white. A similarity was observed in the number of servings consumed by the group during the four experimental sessions, except for participant 3, who presented variations in food consumption during the four experimental sessions. In general, it was observed that the number of servings consumed by most participants ranged between 3 and 4 servings throughout the experiment.
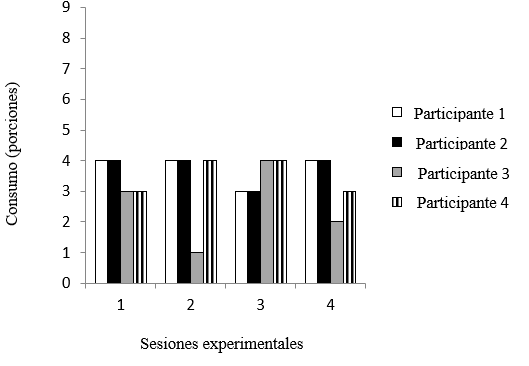
Figure 11. Total consumption of portions during the 4 sessions
Figure 11. Shows the total consumption of portions by each participant in the group exposed to monotonous foods successively during the four experimental sessions. The experimental session in which each consumption was made is indicated at the bottom of the graph. The vertical axis shows the number of portions consumed. The number of participants and the corresponding color are displayed on the figure's left.
Figure 12 shows the food consumption of Group 3 (simultaneous variety). The experimental session where each consumption occurred is indicated at the bottom of the graph. The vertical axis shows the number of portions consumed. On the figure's left is the number of participants and the color corresponding to each one. Participant 1 is represented in white, Participant 2 in black, Participant 3 in gray, and Participant 4 with a black and white striped column. The group generally maintained or increased the portions consumed during session two compared to session 1. In the cases that showed an increase, this was from 1 to 2 portions more than those consumed during the first experimental session, with consumption ranging between 6 and 8 portions. In the cases where consumption was similar to the first session, it ranged between 4 and 6 servings. On the other hand, in most cases, the number of servings consumed during session 4 decreased by approximately 50 % compared to experimental session 2. This indicates that the consumption of servings during the fourth experimental session ranged between 2 and 3 servings in most cases.
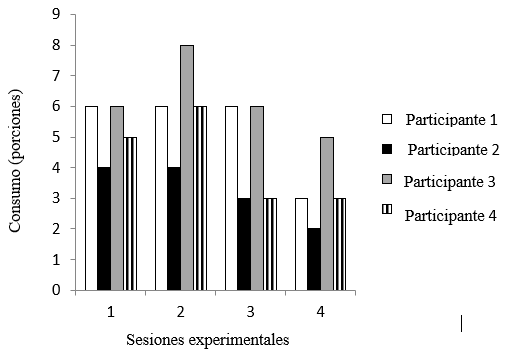
Figure 12. Total consumption of portions during the 4 sessions
Figure 12 shows the total portion consumption by each participant in the group exposed to different foods simultaneously during the 4 experimental sessions. The experimental session in which each consumption was made is indicated at the bottom of the graph. The vertical axis shows the number of portions consumed. The number of participants and the corresponding color are displayed on the figure's left.
Regarding Group 4, which was exposed to different foods in succession, figure 12 shows the total consumption of portions by the group during the four experimental sessions. The bottom part of the graph indicates the experimental session in which each consumption took place. The vertical axis shows the number of portions consumed. The number of participants and the color corresponding to each is indicated on the left of the figure. Participant 1 is represented in white, Participant 2 is described in black, Participant 3 is shown in gray, and Participant 4 has a column striped in black and white. It was observed that the group consumed similar amounts in experimental sessions 1 and 3 and experimental sessions 2 and 4. It was also observed in some cases that in session 2, the number of servings increased by approximately 33 % (2 servings). In other cases, the servings consumed increased by approximately 100 % (3) compared to experimental session 1. Similar data was observed during experimental session 4, in which, in general, the group increased the number of servings consumed during experimental session 4 (2 or 3 servings) compared to experimental session 1.
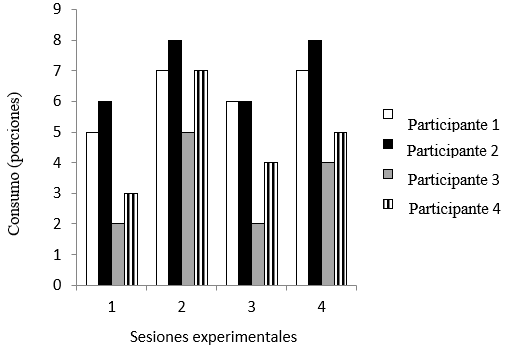
Figure 13. Total consumption of portions during the 4 sessions
Figure 13. Shows the total consumption of portions by each participant in the group exposed to different foods in succession during the four experimental sessions. The bottom part of the graph indicates the experimental session in which each consumption took place. The vertical axis shows the number of portions consumed. The number of participants and the color corresponding to each one are displayed on the figure's left.
Selection latency. Intra-group analysis
Figure 14 shows the selection latency of Group 1 during the four experimental sessions. The experimental session in which the selection was made is indicated at the bottom of the graph. The vertical axis indicates the selection latency time in seconds for each participant. The participant number and the corresponding color are shown on the left side of the figure. Participant 1 is represented in white, Participant 2 is in black, Participant 3 is in gray, and Participant 4 has a column striped in black and white. It was observed that, in most cases, the group made the food selection within 50 seconds. These data were observed in the four experimental sessions. In addition, the selection latency of the 4 participants was higher in experimental session 4 (between 30 and 50 seconds) compared to sessions 2 and 3, in which, in most cases, the latency was around 30 seconds or less.
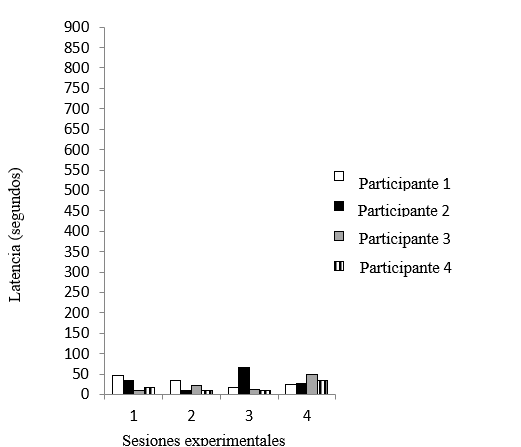
Figure 14. Selection latency during the 4 sessions
Figure 14. It shows the latency of the selection made by each participant in the group exposed to monotonous foods simultaneously during the four experimental sessions. The experimental session in which the choice was made is indicated at the bottom of the graph. The vertical axis indicates the time in seconds of the latency of the selection made by each participant. The number of participants and the color corresponding to each one are shown on the figure's left.
About Group 2, figure 15 shows the selection latency of each participant in the group exposed to monotonous foods in succession during the four experimental sessions. The experimental session in which the selection was made is indicated at the bottom of the graph. The vertical axis indicates the time in seconds of the latency of the selection made by each participant. To the left of the figure is the number of participants and the color corresponding to each one. Participant 1 is represented in white, Participant 2 in black, Participant 3 in gray, and Participant 4 with a column striped in black and white. In all cases, the selection latency progressively increased between one experimental session and another, so in experimental session four, the latency was more significant than 500 seconds in most cases. This indicates that the latency was more critical in experimental session four compared to experimental session 1 (20 seconds in all cases).
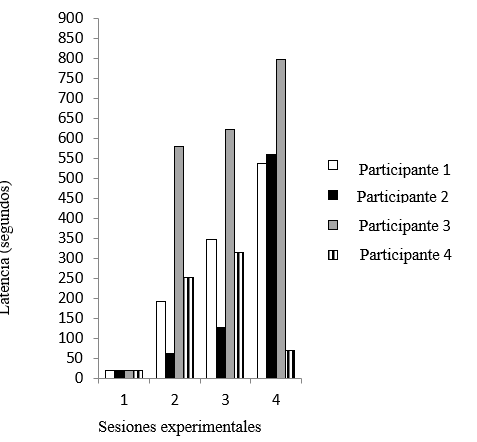
Figure 15. Selection latency during the 4 sessions group 2.
Figure 15. It shows the latency of the selection made by each participant in the group exposed to monotonous foods successively during the four experimental sessions. The experimental session in which the choice was made is indicated at the bottom of the graph. The vertical axis indicates the time in seconds of the latency of the selection made by each participant. The number of participants and the color corresponding to each one are shown on the figure's left.
On the other hand, figure 16 shows the latency of the selection made by each participant in Group 3, who was exposed to various foods simultaneously during the four experimental sessions. The experimental session in which the choice was made is indicated at the bottom of the graph. The vertical axis indicates the selection latency time in seconds for each participant. The participant number and the corresponding color are to the left of the figure. Participant 1 is represented in white, Participant 2 in black, Participant 3 in gray, and Participant 4 with a black and white striped column. The group showed a longer selection latency during experimental session 3 (between 50 and 130 seconds) compared to the latency observed in the other sessions, particularly with experimental session 1 (less than 10 seconds in all cases). The latency between sessions 2 and 4 was 40 and 50 seconds, respectively.
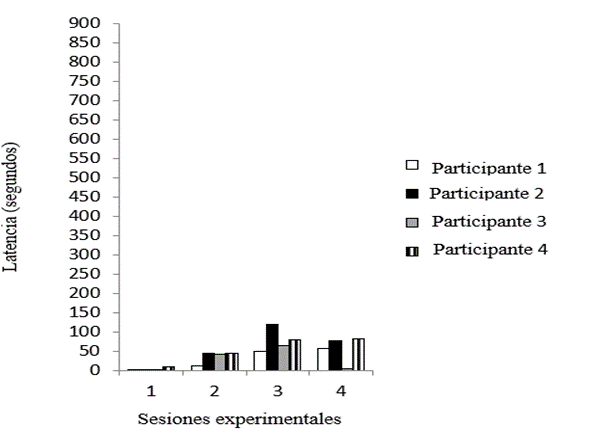
Figure 16. Selection latency during the 4 sessions
Figure 16. It shows the latency of the selection made by each participant in the group who was exposed to different foods simultaneously during the four experimental sessions. The experimental session in which the choice was made is indicated at the bottom of the graph. The vertical axis indicates the time in seconds of the latency of the selection made by each participant. The number of participants and the color corresponding to each one are shown on the figure's left.
Figure 17 shows the latency of food selection made by Group 4, which was exposed to varied foods successively during the four experimental sessions. The experimental session in which the choice was made is indicated at the bottom of the graph. The vertical axis indicates the time in seconds of the latency of the selection made by each participant. The number of participants and the color corresponding to each one are shown on the figure's left. Participant 1 is represented in white, Participant 2 is in black, Participant 3 is in gray, and Participant 4 has a column striped in black and white. It was observed that the latency of food selection increased progressively between experimental session 1 (approximately 5 seconds) and experimental session 4 (approximately 60 seconds).
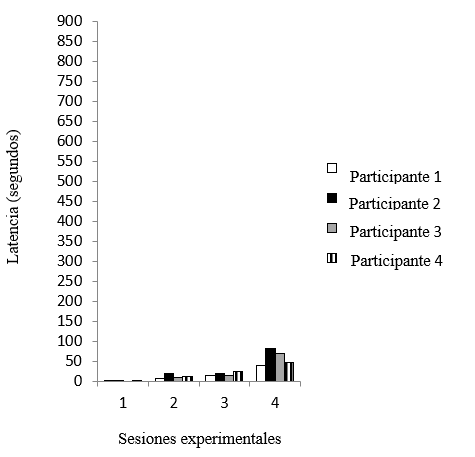
Figure 17. Selection latency during the 4 sessions
Figure 17. It shows the latency of the selection made by each participant in the group exposed to different foods in succession during the four experimental sessions. The experimental session in which the choice was made is indicated at the bottom of the graph. The vertical axis indicates the time in seconds of the latency of the selection made by each participant. The number of participants and the color corresponding to each one are shown on the figure's left.
Consumption latency. Intra-group analysis
Figure 18 shows the latency of food consumption shown by Group 1, which was simultaneously exposed to a monotonous diet. The experimental session in which the consumption was carried out is indicated at the bottom of the graph. The vertical axis indicates the time in seconds of the latency of the consumption made by each participant. The number of participants and the color corresponding to each one are shown on the figure's left. Participant 1 is represented in white, Participant 2 in black, Participant 3 in gray, and Participant 4 with a black and white striped column. It was observed that the group usually began eating the food within 50 seconds. These data were observed in the four experimental sessions. In addition, the latency of consumption of the 4 participants was higher in experimental session 4 (between 30 and 50 seconds) compared to sessions 2 and 3, in which, in most cases, the latency was around 30 seconds or less.
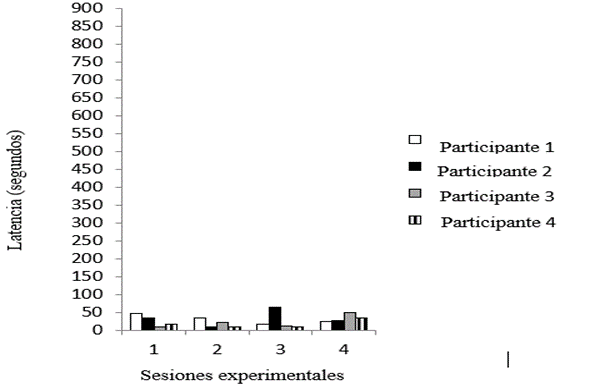
Figure 18. Latency of consumption during the 4 sessions
Figure 18. It shows the latency of consumption by each participant in the group exposed to monotonous foods simultaneously during the four experimental sessions. The experimental session in which the consumption was made is indicated at the bottom of the graph. The vertical axis indicates the time in seconds of the latency of consumption by each participant. The number of participants and the color corresponding to each one are shown on the figure's left.
About Group 2, which was exposed to a successive monotonous diet, figure 19 shows the latency of consumption by each participant in the group exposed to successive monotonous foods during the four experimental sessions. The experimental session in which the consumption occurred is indicated at the bottom of the graph. The vertical axis indicates the time in seconds of the consumption latency performed by each participant. On the left of the figure is the number of participants and the color corresponding to each one. Participant 1 is represented in white, Participant 2 is described in black, Participant 3 is in gray, and Participant 4 has a black-and-white striped column. In all cases, the consumption latency progressively increased between one experimental session and another. In experimental session four, the latency was more significant than 500 seconds in most cases. This indicates that the latency was more important in experimental session 4 in comparison with experimental session 1 (20 seconds, in all cases).
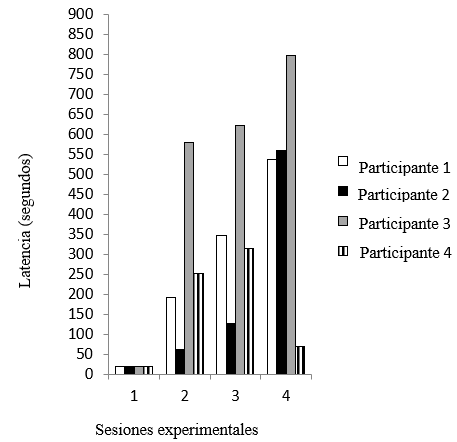
Figure 19. Latency of consumption during the 4 session group 2
Figure 19. It shows the latency of consumption by each participant in the group exposed to monotonous foods successively during the four experimental sessions. The experimental session in which the consumption was carried out is indicated at the bottom of the graph. The vertical axis indicates the time in seconds of the latency of consumption by each participant. The number of participants and the color corresponding to each one are shown on the figure's left.
Figure 20 shows the latency of consumption by each participant in Group 3, who was exposed to a variety of foods simultaneously during the four experimental sessions. The experimental session in which consumption occurred is indicated at the bottom of the graph. The vertical axis indicates the time in seconds of the latency of consumption by each participant. To the figure's left are the participant numbers and the colors corresponding to each one. Participant 1 is represented in white, Participant 2 is described in black, Participant 3 is in gray, and Participant 4 has a black-and-white striped column. The group showed a higher consumption latency during experimental session 3 (between 50 and 130 seconds) than in the other sessions, particularly with experimental session 1 (less than 10 seconds in all cases). In sessions 2 and 4, the latency was 40 and 50 seconds, respectively.
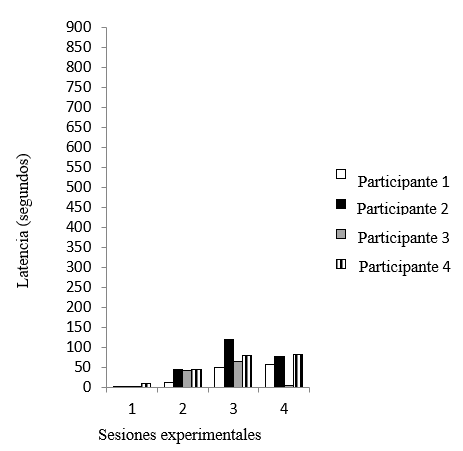
Figure 20. Latency of consumption during the 4 sessions
Figure 20. It shows the latency of consumption by each participant in the group exposed to varied foods simultaneously during the four experimental sessions. The experimental session in which the consumption was carried out is indicated at the bottom of the graph. The vertical axis indicates the time in seconds of the latency of consumption by each participant. The number of participants and the color corresponding to each one are shown on the figure's left.
Figure 21 shows the latency of food consumption by Group 4, exposed to a successive varied diet. The experimental session in which the consumption was made is indicated at the bottom of the graph. The vertical axis indicates the time in seconds of the latency of the consumption made by each participant. The number of participants and the color corresponding to each one are shown on the figure's left. Participant 1 is represented in white, Participant 2 is in black, Participant 3 is in gray, and Participant 4 has a column striped in black and white. It was observed that the group increased the latency of food consumption progressively from experimental session 1 (approximately 5 seconds) to experimental session 4 (approximately 60 seconds).
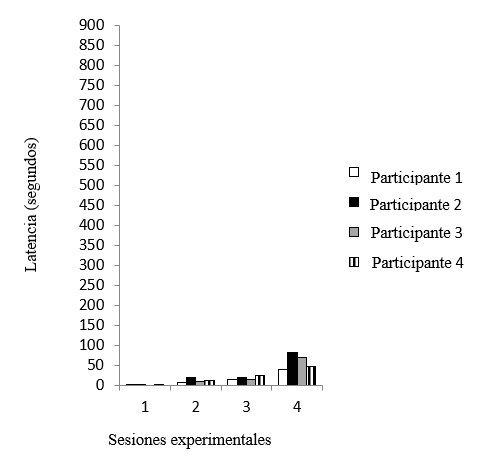
Figure 21. Latency of consumption during the 4 sessions
Figure 21. It shows the latency of consumption by each participant in the group exposed to different foods in succession during the four experimental sessions. The experimental session in which consumption took place is indicated at the bottom of the graph. The vertical axis indicates the time in seconds of the latency of consumption by each participant. The number of the participant and the color corresponding to each one are indicated on the left of the figure.
Sequence of food selection. Intra-group analysis
Table 4 shows the sequence in which the participants in Group 1 selected the monotonous foods when they were provided simultaneously on 4 different plates. It was observed that the selection of foods during the 4 experimental sessions was variable, that is, despite the fact that the foods contained the same ingredients (ham and cheese), the participants selected portions from different plates to consume them.
|
Table 4. Food selection sequence carried out by Group 1, exposed to monotonous foods simultaneously |
|||||||||
|
Experimental session |
Participant |
Sequence of food selection |
|||||||
|
1 |
1 |
P1 |
P3 |
|
|
|
|
|
|
|
2 |
P3 |
P1 |
|
|
|
|
|
|
|
|
3 |
P4 |
P4 |
P3 |
P2 |
P1 |
P2 |
|
|
|
|
4 |
P2 |
P3 |
P1 |
P4 |
P1 |
P4 |
|
|
|
|
2 |
1 |
P3 |
P2 |
|
|
|
|
|
|
|
2 |
P3 |
P1 |
|
|
|
|
|
|
|
|
3 |
P1 |
P3 |
P2 |
P4 |
P3 |
P2 |
|
|
|
|
4 |
P3 |
P2 |
P4 |
P1 |
P3 |
|
|
|
|
|
3 |
1 |
P1 |
P3 |
|
|
|
|
|
|
|
2 |
P1 |
P4 |
|
|
|
|
|
|
|
|
3 |
P2 |
P2 |
P4 |
P4 |
P4 |
P4 |
|
|
|
|
4 |
P1 |
P2 |
P3 |
P4 |
P1 |
|
|
|
|
|
4 |
1 |
P1 |
P2 |
|
|
|
|
|
|
|
2 |
P4 |
P3 |
P4 |
|
|
|
|
|
|
|
3 |
P4 |
P4 |
P3 |
P2 |
P3 |
P4 |
|
|
|
|
4 |
P1 |
P2 |
P3 |
P4 |
P4 |
P4 |
|
|
|
It shows the portions of food selected by each participant in the group who was exposed to monotonous foods simultaneously. The symbols P1, P2, P3, and P4 indicate the plate from which each selected portion of food was taken. The foods provided on the four plates were ham and cheese sandwiches.
In table 5, it can be seen that in experimental session 1, the group selected similar quantities of food from each plate provided (4 portions on average). In experimental session 2, participants selected more portions from plate 3 (6 portions), followed by plate 2 (4 portions). In contrast, during experimental session 3, participants selected a more significant number of portions from plates 1 (4 portions) and 4 (6 portions). Finally, during experimental session 4, participants selected a more significant number of portions from plate 4 (equivalent to 8 portions) than the other plates (ranging from 2 to 4 portions). In general, it was observed that during the four experimental sessions a more significant number of portions were selected from dishes 3 (16 portions) and 4 (20 portions), even though they all contained the same ingredients (ham and cheese).
|
Table 5. Total number of portions selected from each food dish, by Group 1 |
||
|
Experimental session |
Food platter |
Total number of servings selected by the group |
|
1 |
P1 |
5 |
|
P2 |
3 |
|
|
P3 |
4 |
|
|
P4 |
4 |
|
|
2 |
P1 |
3 |
|
P2 |
4 |
|
|
P3 |
6 |
|
|
P4 |
2 |
|
|
3 |
P1 |
4 |
|
P2 |
3 |
|
|
P3 |
2 |
|
|
P4 |
6 |
|
|
4 |
P1 |
2 |
|
P2 |
3 |
|
|
P3 |
4 |
|
|
P4 |
8 |
|
It shows the course number in which the food was provided and the total number of portions that Group 1 (exposed to monotonous food during the 4 experimental sessions) selected from each course during each experimental session.
Regarding the sequence of food selection made by Group 3 (exposed to varied foods simultaneously), no clear trend was observed during the first 3 experimental sessions. However, during session 4, the participants initially selected portions of the chicken sandwich and ended with the jam sandwich portions (table 6).
|
Table 6. Food selection sequence performed by Group 3, exposed to the varied foods simultaneously |
|||||||||
|
Experimental session |
Participant |
Sequence of food selection |
|||||||
|
1 |
1 |
P2/pa |
P2/pa |
P1/me |
P1/me |
P3/po |
P1/me |
|
|
|
2 |
P2/pa |
P2/pa |
P1/me |
P1/me |
|
|
|
|
|
|
3 |
P4/jaq |
P3/po |
P2/pa |
P3/po |
P3/po |
P1/me |
|
|
|
|
4 |
P4/jaq |
P3/po |
P2/pa |
P1/me |
P3/po |
|
|
|
|
|
2 |
1 |
P1/me |
P4/jaq |
P3/po |
P2/pa |
P4/jaq |
P1/me |
|
|
|
2 |
P2/pa |
P3/po |
P1/me |
P1/me |
|
|
|
|
|
|
3 |
P3/po |
P2/pa |
P4/jaq |
P2/pa |
P2/pa |
P1/me |
P1/me |
P1/me |
|
|
4 |
P3/po |
P2/pa |
P2/pa |
P4/jaq |
P3/po |
P1/me |
|
|
|
|
3 |
1 |
P1/me |
P3/po |
P3/po |
P3/po |
P3/po |
P1/me |
|
|
|
2 |
P1/me |
P2/pa |
P1/me |
|
|
|
|
|
|
|
3 |
P3/po |
P3/po |
P2/pa |
P2/pa |
P1/me |
P1/me |
|
|
|
|
4 |
P3/po |
P2/pa |
P4/jaq |
|
|
|
|
|
|
|
4 |
1 |
P3/po |
P3/po |
P1/me |
|
|
|
|
|
|
2 |
P3/po |
P2/pa |
|
|
|
|
|
|
|
|
3 |
P3/po |
P3/po |
P2/pa |
P1/me |
P1/me |
|
|
|
|
|
4 |
P3/po |
P2/pa |
P1/me |
|
|
|
|
|
|
It shows the portions of food selected by each participant in the group who was exposed to monotonous foods simultaneously. The symbols P1, P2, P3, and P4 indicate the dish from which each selected portion of food was taken. In P1, marmalade sandwiches (me) were provided; in P2, brown sugar loaf sandwiches (pa) were provided; in P3, chicken sandwiches (po) were provided; and in P4, ham and cheese sandwiches (jaq) were provided.
Table 7 shows the number of portions selected for each type of food provided to Group 3 (simultaneous variety) during the four experimental sessions. During experimental session 1, the participants chose mainly jam (7 portions), chicken (6 portions), and brown sugar (6 portions) sandwiches, with the ham and cheese being the least selected (2 portions). During experimental session 2, the foods most selected were the jam (8 portions) and brown sugar (7 portions) sandwiches. In contrast, in experimental sessions 3 and 4, the foods most selected were the chicken (7 and 6 portions, respectively) and jam (6 and 4 portions, respectively) sandwiches. In general, it was observed that during the four experimental sessions, a more significant number of portions of the jam (25 portions) and chicken (24 portions) sandwiches were selected.
|
Table 7. Type of food and total number of servings selected by Group 3, exposed to the varied foods simultaneously |
||
|
Experimental session |
Type of food |
Total number of servings selected by the group |
|
1 |
Ham and cheese |
2 |
|
Chicken |
6 |
|
|
Brown sugar |
6 |
|
|
Jam |
7 |
|
|
2 |
Ham and cheese |
4 |
|
Chicken |
5 |
|
|
Brown sugar |
7 |
|
|
Jam |
8 |
|
|
3 |
Ham and cheese |
1 |
|
Chicken |
7 |
|
|
Brown sugar |
4 |
|
|
Jam |
6 |
|
|
4 |
Ham and cheese |
0 |
|
Chicken |
6 |
|
|
Brown sugar |
3 |
|
|
Jam |
4 |
|
It shows the types of food provided to the participants of Group 3, who were exposed to varied foods during the four experimental sessions. The four types of food provided and the total number of portions selected by the group in each experimental session are indicated.
Frequency of food selection. Intra-group analysis
Figure 22 shows the frequency of selection made by Group 1 (simultaneous monotony). Each color indicates the time interval between one selection and another. Interval 1 is displayed in black. White refers to interval 2. Interval 3 is shown in gray. Interval 4 is marked with a white background and black dots, while interval five is represented with a white background and diagonal lines. Finally, white with horizontal lines refers to interval 6, and black with white dots refers to interval 7. It was observed that the first selection interval lasted approximately 5 minutes in all cases during the four experimental sessions. In addition, it was observed that only 2 participants maintained the selection of foods beyond 15 minutes during the four experimental sessions. In addition, in the cases where there were two or more selection intervals, these increased in duration variably and progressively between one selection and the next. This effect was observed in most cases during the four experimental sessions. Finally, the frequency of food selection by each participant was similar in each experimental session.
Figure 22. It shows the frequency of selection of monotonous foods made by each participant in the four experimental sessions when the foods were provided simultaneously. Each color indicates the time interval between one selection and another. Interval 1 is displayed in black. The color white refers to interval 2. Interval 3 is shown in gray. Interval 4 is marked with a white background and black dots, while interval five is represented with a white background and diagonal lines. Finally, white with horizontal lines refers to interval 6, and black with white dots refers to interval 7.
Figure 23 shows the selection frequency made by Group 4 (successive monotony). Each color indicates the interval of time elapsed between one selection and another. Interval 1 is displayed in black. White refers to interval 2. Interval 3 is shown in gray. Interval 4 is marked with a white background and black dots, while interval five is represented with a white background and diagonal lines. Finally, white with horizontal lines refers to interval 6, and black with white dots refers to interval 7. It was observed that 2 of the participants continued to select foods up to 10 minutes after the start of the experimental session. This was observed during the four experimental sessions. The first food selection interval lasted between 3 and 5 minutes, in most cases, during the four experimental sessions. The second interval generally lasted a similar length to the first interval. Additionally, in cases where a third interval occurred, this also lasted less than the second interval (less than 5 minutes). Finally, the frequency of food selection by each participant varied in each experimental session, so it was impossible to identify a trend in the group.
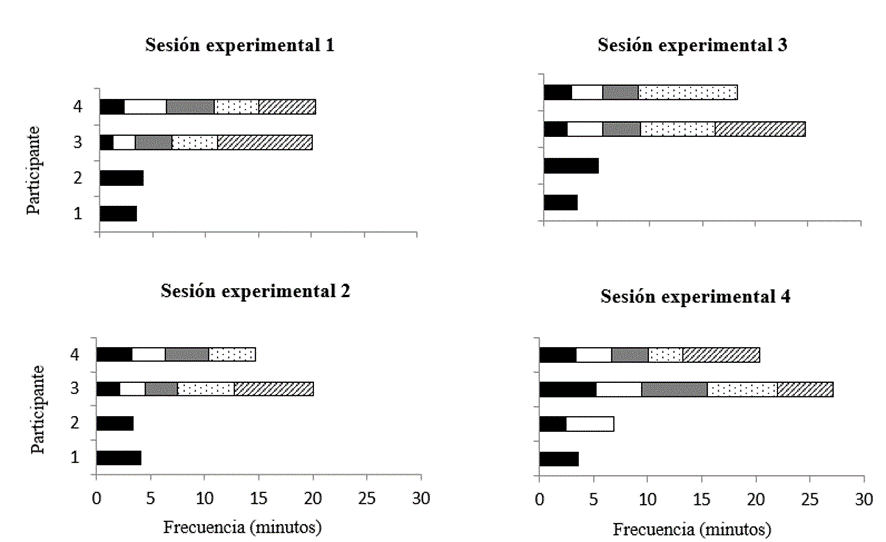
Figure 22. Frequency of selection of foods from group 1 (simultaneous monotony) during the 4 experimental sessions
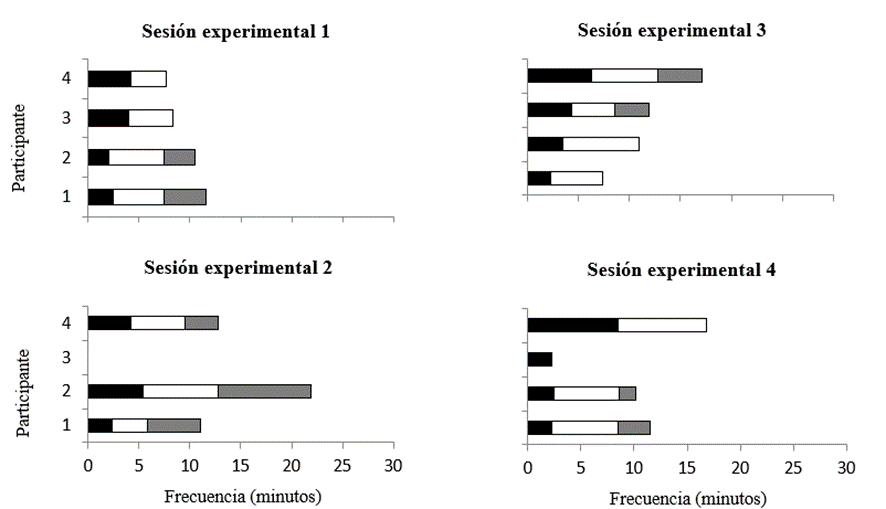
Figure 23. Frequency of selection of foods from group 2 (successive monotony) during the 4 experimental sessions
Figure 23. It shows the frequency of selection of monotonous foods made by each participant in the four experimental sessions when they were provided successively. Each color indicates the time interval elapsed between one selection and another. Interval 1 is displayed in black. White refers to interval 2. Interval 3 is shown in gray. A white background with black dots marks interval 4, while a white background with diagonal lines represents interval five. Finally, white with horizontal lines refers to interval 6, and black with white dots refers to interval 7.
Figure 24 shows the frequency of selection made by Group 3 (simultaneous variety). Each color indicates the time interval between one selection and another. Interval 1 is displayed in black. White refers to interval 2. Interval 3 is shown in gray. Interval 4 is marked with a white background and black dots, while interval five is represented with a white background and diagonal lines. Finally, white with horizontal lines refers to interval 6, and black with white dots refers to interval 7. It is generally shown that the selection duration was shorter during experimental session 4 (less than 15 minutes). In all cases, the second interval lasted longer than the first interval; this was observed during the four experimental sessions. On the other hand, the frequency of food selection by each participant varied in each experimental session, so no general trends were observed.
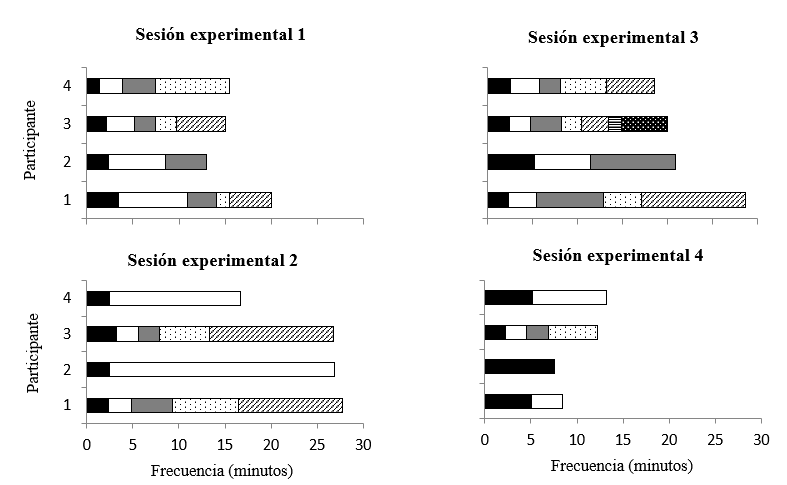
Figure 24. Frequency of selection of foods from group 3 (simultaneous variety) during the 4 experimental sessions
Figure 24. It shows the frequency of selection of different foods by each participant in the four experimental sessions when the foods were provided simultaneously. Each color indicates the time interval between one selection and another. Interval 1 is displayed in black. White refers to interval 2. Interval 3 is shown in gray. Interval 4 is marked with a white background and black dots, while interval five is represented with a white background and diagonal lines. Finally, white with horizontal lines refers to interval 6, and black with white dots refers to interval 7.
Finally, figure 25 shows the selection frequency made by Group 4 (successive variety). Each color indicates the time interval between one selection and another. Interval 1 is displayed in black. White refers to interval 2. Interval 3 is shown in gray. Interval 4 is marked with a white background and black dots, while interval five is represented with a white background and diagonal lines. Finally, white with horizontal lines refers to interval 6, and black with white dots refers to interval 7.
In most cases, participants selected foods throughout the experimental session (about 25 minutes). This was observed during the four experimental sessions. On the other hand, it was observed that the time intervals between one selection and another were similar in the four experimental sessions. On the other hand, the frequency of food selection by each participant was variable in each experimental session, so no general trends were observed.
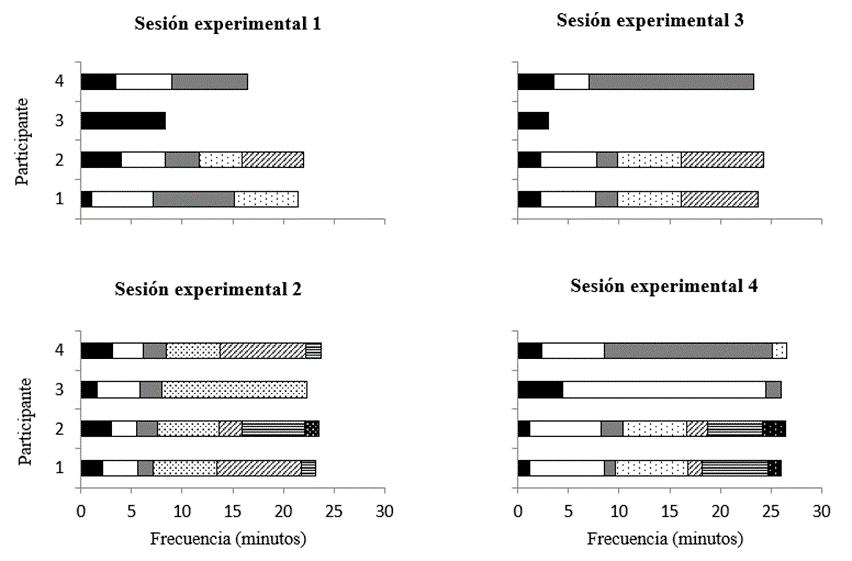
Figure 25. Frequency of selection of foods from group 4 (successive variety) during the 4 experimental sessions
Figure 25. It shows the frequency of selection of different foods by each participant in the four experimental sessions when they were provided successively. Each color indicates the time interval between one selection and another. Interval 1 is displayed in black. The color white refers to interval 2. Interval 3 is shown in gray. Interval 4 is indicated with a white background and black dots, while interval five is represented with a white background and diagonal lines. Finally, white with horizontal lines refers to interval six, and black with white dots refers to interval 7.
Selection and consumption. Intergroup analysis
In tables 8 and 9, it can be seen that Group 1 (simultaneous monotony) selected and consumed 63 portions; Group 2 (successive monotony) selected and consumed 54 portions; on the other hand, Group 3 (simultaneous variety) selected and consumed 76 portions; and, finally, Group 4 (successive variety) selected and consumed 87 servings. This allows us to identify that the groups exposed to varied foods selected and consumed more food (13 and 33 servings more) than those exposed to monotonous foods, regardless of whether the foods were provided simultaneously or successively. On the other hand, it was observed that the group exposed to monotonous foods simultaneously selected and consumed nine more servings than the group exposed to foods successively. While the group exposed to varied foods successively selected and consumed 11 more servings than the group exposed to varied foods simultaneously.
|
Table 8. Number of portions selected by the groups during the experimental sessions and total number of portions selected during the experiment |
|||||
|
Group and experimental condition |
Number of portions selected in each experimental session |
Total number of portions selected during the experiment |
|||
|
Session 1 |
Session 2 |
Session 3 |
Session 4 |
||
|
Group 1. Simultaneous monotony |
16 |
15 |
15 |
17 |
63 |
|
Group 2. Successive monotony |
14 |
13 |
14 |
13 |
54 |
|
Group 3. Simultaneous variety |
21 |
24 |
18 |
13 |
76 |
|
Group 4. Successive variety |
17 |
27 |
18 |
25 |
87 |
|
Table 9. Number of portions consumed by the groups during the experimental sessions and total number of portions consumed during the experiment |
|||||
|
Group and experimental condition |
Number of servings consumed in each experimental session |
Total number of servings consumed during the experiment |
|||
|
Session 1 |
Session 2 |
Session 3 |
Session 4 |
||
|
Group 1. Simultaneous monotony |
16 |
15 |
15 |
17 |
63 |
|
Group 2. Successive monotony |
14 |
13 |
14 |
13 |
54 |
|
Group 3. Simultaneous variety |
21 |
24 |
18 |
13 |
76 |
|
Group 4. Successive variety |
17 |
27 |
18 |
25 |
87 |
Comparison between selection and consumption of food by the four experimental groups during the four experimental sessions:
In the four experimental groups, food consumption during the four experimental sessions was equivalent to the number of portions selected by each participant and by each group. That is, the participants in each group selected a portion, and once selected, they consumed it (tables 8 and 9).
Discussion
The main results of Experiment 2 showed that the groups exposed to the varied diet selected and consumed a greater quantity of food than those exposed to the monotonous diet, regardless of whether the food was provided simultaneously or successively. This is in line with what has been reported in different studies regarding the fact that sensory satiety is specific to foods previously consumed in a meal with similar sensory characteristics (monotonous diet). Therefore, presenting foods with different sensory characteristics will encourage greater consumption of food (Armitage, Hervey, Rolls, Rowe & Tobin, 1983; Barber, Viña, Viña & Cabo, 1985; Booth, 1987; Hetherington & Rolls, 1996; Johnson & Vickers, 1993; McCrory et al., 1999; Ramírez, 1987; Raynor & Epstein, 2001; Rolls, 1993; Rolls, Rowe, Rolls, Kingston, Megson, & Gunary, 1980).
On the other hand, Rolls (1993) and Rolls, Rowe, Rolls, Kingston, Megson, & Gunary (1980) pointed out that the presentation of a varied diet simultaneously (similar to a buffet) encourages appetite and, therefore, consumption will be more significant compared to when a monotonous diet is presented or when the varied diet is presented successively (as in a meal served in different courses and at other times). In our study, this effect was not observed, as the group exposed to monotonous foods simultaneously selected and consumed more food than the group exposed to foods in succession, while the group exposed to varied foods in succession selected and consumed a greater quantity of food compared to the group exposed to varied foods simultaneously. This could be due to the participants' satiety or the study's novelty.
In the four experimental groups, food consumption during the four experimental sessions was equivalent to the number of portions selected by each participant. That is, the participants in each group selected one portion and, once selected, consumed it immediately. This explains why the selection and consumption latency were similar in all the experimental phases.
In general, it was observed that the selection and consumption latencies increased progressively as the experimental sessions progressed. These data were observed in groups 2, 3, and 4, while in group 1, the selection and consumption latencies did not show considerable variations during the four experimental sessions. This could be explained by the monotony effect (Rolls, 1993), even when some groups were provided with varied diets, as the participants could consider them monotonous when identical diets were provided during four experimental sessions (or for more extended periods).
It was also observed that the selection and consumption latencies were more lavish in group 2, which was exposed to a monotonous diet in succession, compared to the other three groups. This could be explained by the low level of stimulation produced by the bland diet, in contrast with the varied diets, which leads to a decreased preference for this diet. Consequently, the participants will avoid or postpone food consumption until it is possible for them to get other food or until hunger induces them to consume the available food (Rolls, 1993; Rolls & de Waal, 1985).
Another critical piece of data to analyze relates to the variability in the frequency of food selection and consumption and the duration of consumption observed in all groups. In this regard, Rolls (1993) and Hetherington & Rolls (1996) pointed out that the long-term effects of monotonous foods persist between meals and even from day to day. They also indicated that these long-term effects could be due to cognitions (i.e., knowledge about a recently consumed food, the memory of its sensory properties, and expectations about the impact of a food). Due to the above, it is likely that the participants, seeing that the foods were the same and would have free access to them or that the same food would be presented at subsequent intervals, decided when they would consume the portions and not from the beginning.
Regarding the sequence of food selection made by the groups exposed simultaneously, it is worth noting that the participants exposed to a monotonous diet selected foods from different dishes even when the foods contained the same ingredients, perhaps to look for a different food Regarding the selection of foods made by the group exposed to the varied diet, it was observed that the participants showed a preference for foods with contrasting sensory characteristics, that is, primarily salty and sweet. These results can be explained if we return to Rolls' (1993) argument that individuals usually consume food trying to maintain palatability in a meal, and therefore, the order in which food and drink are consumed would have the objective of preserving oropharyngeal stimulation. That is to say, a probable explanation for the data obtained in our study would be related to the fact that the individuals consumed food from different plates, trying to make their meals more varied, even when they identified that the food contained the same ingredients (in the case of the groups exposed to the monotonous diet). It is also important to point out that the fact that the groups did not identify a trend in the sequence of food selection could be related to the individual preferences of the participants and not so much to the effects of the SSE (Rolls, 1993).
Concerning the frequency of food selection, it was observed that the groups exposed to the varied diet made selections more frequently and that the selection duration was more significant compared to the groups exposed to the monotonous diet. In contrast, in the groups exposed to monotonous diets, more considerable variability was observed, indicating that half of the participants, or at least one, did not make selections frequently and that they presented food selection with a short duration. However, in the successive monotony group, more excellent uniformity in the selections was observed; that is to say, the majority of the participants presented short durations and similar results to each other, in comparison with the group exposed to the simultaneous monotony diet, who selected the foods with variable frequencies and in some cases presented long durations and in others very short.
This aligns with the reports of Rolls, Rowe, Rolls, Kingston, Megson, and Gunary (1981) and Rolls, Rowe, and Rolls (1982), who pointed out that SSE occurs with foods previously consumed during a meal. Therefore, offering a variety of foods keeps the appetite going for longer. In this case, the quantity of food selected and consumed will be less, and consumption will occur over a shorter period.
Exposure to monotonous and varied diets and how they are presented (simultaneously or successively) influenced food selection and consumption, affecting the latency, frequency, sequence, and duration of consumption (Raynor & Epstein, 2001).
Experiment 3
Based on the results obtained in Experiment 2, it was proposed that the design of Experiment 2 be replicated in a Spanish population and that the foods be adapted to the diets they consume daily. The general objective of this experiment was to extend the behavioral results obtained in Experiment 2 in a similar experimental situation and modify the variables. This will allow us to verify and demonstrate the generality of the effects of SSE and strengthen TSSE in terms of behavioral effects.
Hetherington & Rolls (1996, p. 286) noted that SSE is observed in various animal species and humans. Additionally, they pointed out that it is a universal and highly replicable phenomenon.
Based on this information, the following research question was posed: Will the results obtained in Experiment 2 be similar if the study is carried out on a different population and with other foods?
Based on the above, this experiment had two specific objectives: 1) To evaluate the effects of exposing participants to monotonous or varied diets, simultaneously or successively, on consumption behavior and 2) To identify the differences and/or similarities between the effects on the resulting behavioral parameters and the effects on the behavioral parameters observed in Experiment 2.
Method
Participants
Sixteen volunteer students of both sexes, aged between 18 and 27, were experimentally naive. The participants were students from the Faculty of Psychology at the University of Murcia, Spain.
Experimental situation
The experiments were conducted in the Department of Human Anatomy and Psychobiology laboratories at the University of Murcia, Spain. These spaces are approximately 5m by 5m and have adequate lighting and furniture for the study.
Apparatus and materials
Two Sony DSH-HC32 cameras with tripods were used to record the experimental sessions and subsequently analyze the behaviors observed. In addition, a computer system with the necessary programs was used to analyze the videos and data obtained.
The food provided was toast (white baguette-type bread cut crosswise and lightly toasted) with different ingredients, which were classified according to the type of diet: a) Monotonous diet: toast with grated tomato; and b) Varied diet: 1) toast with grated tomato; 2) toast with butter; 3) toast with olive oil and, 4) toast with strawberry jam. The portion in this experiment corresponded to a quarter of a loaf of white bread (half a slice); therefore, each slice of toast is equivalent to 2 portions. Each participant was given 250 milliliters of orange juice to drink. The following table shows the calorie content of each of the foods (table 10).
|
Table 10. Calorie content of each food |
|
|
Food |
Calories |
|
Tomato toast |
23kcal |
|
Olive oil toast |
57kcal |
|
Butter toast |
60kcal |
|
Jam toast |
54kcal |
|
Orange juice |
54kcal |
|
Source: The number of calories per food was determined based on the Mexican System of Equivalent Foods (Marván, Pérez & Palacios, 2004). |
|
Procedure
1. Sample selection: authorization to carry out the study was first requested from the institution, once its objective had been explained. Subsequently, the psychology classrooms were visited to invite students to participate voluntarily in the study. Those students who agreed to participate received an extra point in a subject. Once the sample had been constituted, each of the students was provided with an informed consent and a letter of commitment, as well as summons specifying the date, time and location of the study.
2. Formation of the experimental groups: the participants were randomly assigned to one of the four experimental groups and were given their summons. They were asked to attend their appointment having gone without food for approximately 4 to 5 hours.
3. Conduct of the experiment: once the participants were at the study site, they were told that they could consume whatever food they wanted until they felt satisfied.
4. Data recording and analysis: The measures used in the data analysis for the groups exposed simultaneously were the number of portions selected and the number of portions consumed, selection latency and consumption latency, and the frequency and sequence of selection. In the groups that were exposed successively, the variables of several portions selected and the number of portions consumed, selection latency and consumption latency, and the frequency of selection were evaluated. To facilitate the analysis of these variables, some records were made during the experimental sessions, mainly the number of portions consumed by each participant, and the experimental sessions were videotaped. The consumption of portions was calculated by adding up the portions eaten during the experimental sessions. In the data analysis, the total number of portions selected and the total number of portions consumed by each participant in each group for the four study sessions were recorded. In addition, the latency of selection and consumption of the portions, the sequence, and the selection frequency were analyzed. The data was analyzed and graphed using Microsoft Excel 2010 for Windows.
Experimental design
Four experimental groups were formed, with four participants (two men and two women). The participants were assigned to the groups at random.
Groups 1 and 3 were exposed to the foods simultaneously. For these groups, the experiment was carried out in four experimental sessions, each lasting approximately 30 minutes. The foods were placed on trays or plates numbered 1 to 4, and at the end of 30 minutes, they were removed. Participants were instructed to consume the food until they were satisfied.
Groups 2 and 4 were exposed to the food in succession, and the experiment was carried out in four experimental sessions. Each session had four intervals, each lasting 8 minutes. Each interval gave them a plate with two portions, equivalent to a piece of toast. At the end of each interval, two researchers entered the room, removed the plate, and placed a new one with another two portions until four deliveries were completed.
In the four experimental sessions, groups 1 and 2 had access to monotonous foods, while groups 3 and 4 were exposed to varied foods. Recordings were made, and food consumption was recorded according to the design in figure 26.
Results
The results obtained in Experiment 3 are described below. Initially, an intragroup analysis was carried out of the number of portions selected and consumed portions, selection latency and consumption latency, and frequency and sequence of selection (for the groups that were exposed to the foods simultaneously). Similarly, the variables of number of portions selected and number of portions consumed, selection latency and consumption latency, and the frequency of selection (for the groups that were exposed to the foods successively) were analyzed. Subsequently, an intergroup analysis was carried out on the selection and consumption of portions and a comparison between the selection and consumption of food in the four experimental groups during the four experimental sessions.
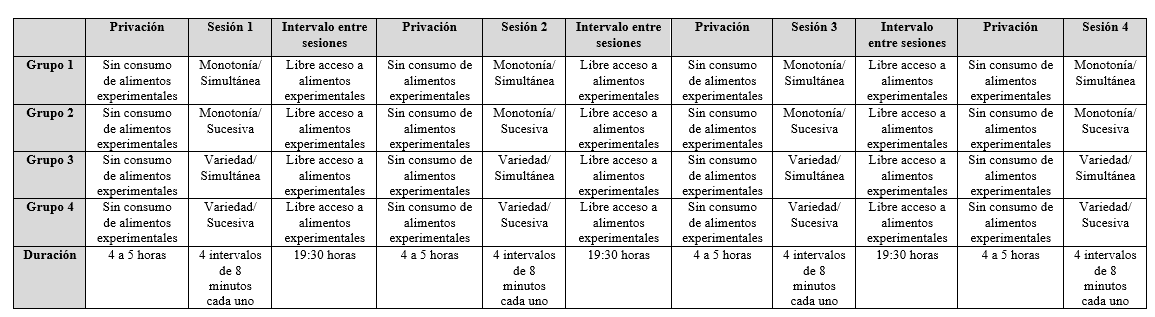
Figure 26. Design of Experiment 3
It shows the design of Experiment 3, indicating the conditions to which each experimental group was exposed, the duration of each condition, and the differences established for each group.
Selection. Intra-group analysis
Figure 27 shows the total selection of portions made by each participant in the group exposed to monotonous foods simultaneously during the four experimental sessions. The experimental session in which each selection was made is indicated at the bottom of the graph. The vertical axis indicates the number of portions selected. The number of participants and the corresponding color are indicated on the figure's left. Participant 1 is represented in white, Participant 2 is represented in black, Participant 3 is shown in gray, and Participant 4 has a column striped in black and white. It was observed that 2 participants showed a progressive increase in the number of servings selected between experimental session 1 (4 or 5 servings) and experimental session 4 (7 servings). This indicates an increase of 2 to 3 servings between each experimental session. On the other hand, the other 2 participants selected a similar number of servings in the four experimental sessions (2 or 3 servings and one serving, respectively). In general, it was observed that the group selected a more significant number of servings in experimental sessions 3 and 4 (18 servings) compared to experimental sessions 1 and 2 (13 and 15 servings, respectively).
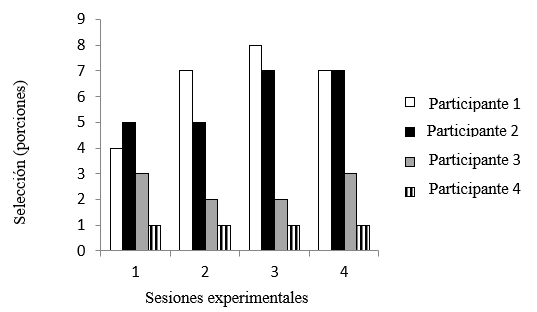
Figure 27. Total number of portions selected by each participant in the 4 experimental sessions Group 1. Simultaneous monotony
Figure 27. Shows the total selection of portions made by each participant in the group exposed to monotonous foods simultaneously during the four experimental sessions. The experimental session in which each selection was made is indicated at the bottom of the graph. The vertical axis indicates the number of portions selected. The number of participants and the corresponding color are indicated on the figure's left.
Figure 28 shows the total selection of portions made by each participant in the group exposed to monotonous foods in succession during the four experimental sessions. The experimental session in which each selection was made is indicated at the bottom of the graph. The vertical axis indicates the number of portions selected. To the figure's left is the number of participants and the color corresponding to each one. Participant 1 is represented in white, Participant 2 is represented in black, Participant 3 is shown in gray, and Participant 4 has a column striped in black and white. It was observed that the group selected fewer portions during experimental sessions 1 and 4 (9 and 8 portions, respectively) compared to experimental sessions 2 and 3 (13 portions selected in each session). This indicates that most participants selected four more portions during experimental sessions 2 and 3, compared to experimental session 1. Subsequently, group selection decreased during experimental session 4, with five fewer portions. These results indicated that the group selection made during experimental session 4 was lower, even lower than that made during experimental session 1.
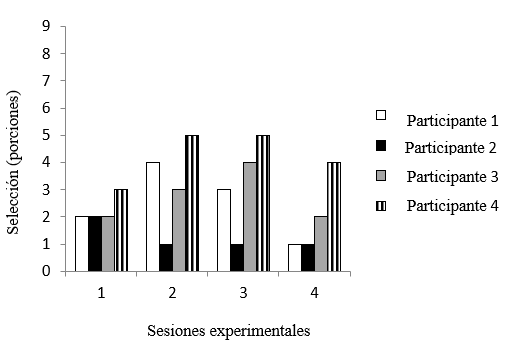
Figure 28. Total number of portions selected by each participant in the 4 experimental sessions Group 2. Successive monotony
Figure 28. It shows the total selection of portions made by each participant in the group exposed to monotonous foods successively during the four experimental sessions. The experimental session in which each selection was made is indicated at the bottom of the graph. The vertical axis indicates the number of portions selected. The number of participants and the corresponding color are indicated on the figure's left.
Figure 29 shows the selection made by group 3, which was simultaneously exposed to a varied diet during the four experimental sessions. The experimental session in which each selection was made is indicated at the bottom of the graph. The vertical axis indicates the number of portions selected. To the figure's left is the number of participants and the color corresponding to each one. Participant 1 is represented in white, Participant 2 is represented in black, Participant 3 is shown in gray, and Participant 4 is represented in a black-and-white striped column. In general, it was observed that the participants made a similar selection of portions during experimental sessions: 1 (17 portions), 2 (19 portions), and 4 (18 portions). In comparison, the number of portions selected during experimental session 3 was lower in most participants (1 or 2 portions), with a group selection of 14.
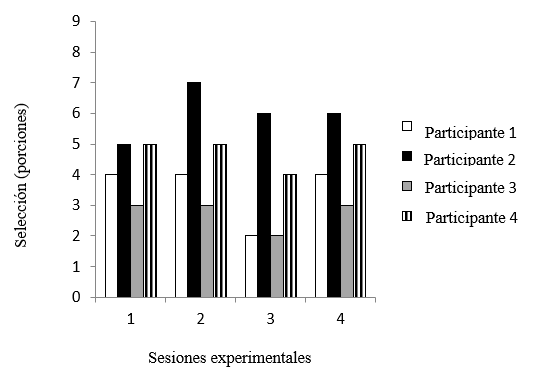
Figure 29. Total number of portions selected by each participant in the 4 experimental sessions Group 3. Simultaneous variety
Figure 29. Shows the total selection of portions made by each participant in the group exposed to varied foods simultaneously during the four experimental sessions. The experimental session in which each selection was made is indicated at the bottom of the graph. The vertical axis indicates the number of portions selected. The number of participants and the corresponding color are indicated on the figure's left.
Regarding the selection made by group 4, which was exposed to successive varieties, figure 30 shows the total selection of portions made by each participant in the group exposed to successively varied foods during the four experimental sessions. The experimental session in which each selection was made is indicated at the bottom of the graph. The vertical axis indicates the number of portions selected. To the figure's left is the number of participants and the color corresponding to each one. Participant 1 is represented in white, Participant 2 is represented in black, Participant 3 is shown in gray, and Participant 4 is represented in a black-and-white striped column. It was observed that three of the participants selected 1 to 3 more portions towards the second, third, and fourth experimental sessions, compared to the first session. Thus, a group selection of 22 portions was observed in sessions 2 and 4 and 20 portions in experimental session 3, while in experimental session 1, the selection was 18 portions. In general, the number of servings selected was lower in experimental session 1, and the highest selection was made during sessions 2 and 4, except for participant 1, who selected 1 or 2 more servings in experimental session one compared to experimental sessions 2, 3 and 4.
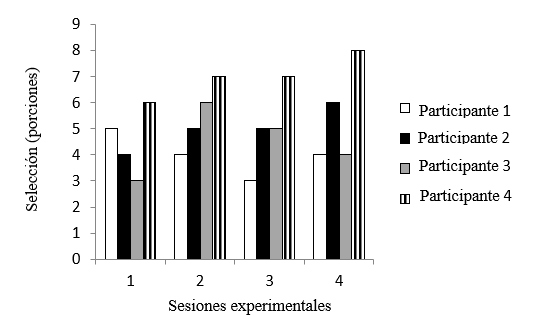
Figure 30. Total number of portions selected by each participant in the 4 experimental sessions Group 4. Successive variety
Figure 30. It shows the total selection of portions made by each participant in the group exposed to varied foods successively during the four experimental sessions. The experimental session in which each selection was made is indicated at the bottom of the graph. The vertical axis indicates the number of portions selected. The number of participants and the corresponding color are indicated on the figure's left.
Consumption. Intra-group analysis
Figure 31 shows the total consumption of portions by each participant in the group exposed to monotonous foods simultaneously during the four experimental sessions. The experimental session in which each consumption was made is indicated at the bottom of the graph. The vertical axis indicates the number of portions consumed. The number of participants and the corresponding color are indicated on the figure's left. Participant 1 is represented in white, Participant 2 is represented in black, Participant 3 is shown in gray, and Participant 4 has a column striped in black and white. It was observed that 2 participants showed a progressive increase in the number of servings consumed between experimental session 1 (4 or 5 servings) and experimental session 4 (7 servings). This indicates an increase of 2 to 3 servings between each experimental session. On the other hand, the other 2 participants consumed a similar number of servings in the four experimental sessions (2 or 3 servings and one serving, respectively). In general, it was observed that the group consumed a more significant number of servings in experimental sessions 3 and 4 (18 servings) compared to experimental sessions 1 and 2 (13 and 15 servings, respectively).
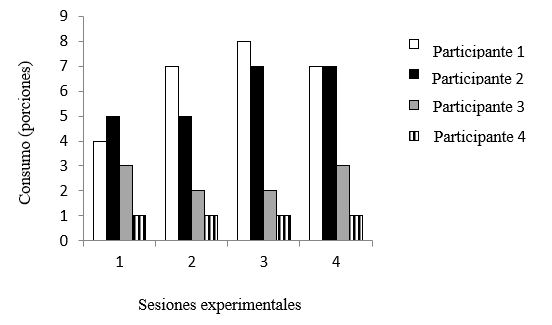
Figure 31. Total consumption of portions during the 4 sessions group 1. Simultaneous monotony
Figure 31. It shows the total consumption of portions by each participant in the group exposed to monotonous foods simultaneously during the four experimental sessions. The experimental session in which each consumption was made is indicated at the bottom of the graph. The vertical axis indicates the number of portions consumed. The number of participants and the corresponding color are indicated on the figure's left.
Figure 32 shows the total consumption of portions by each participant in the group exposed to monotonous foods in succession during the four experimental sessions. The bottom part of the graph indicates the experimental session in which each consumption took place. The vertical axis indicates the number of servings consumed. To the figure's left is the number of participants and the color corresponding to each one. Participant 1 is represented in white, Participant 2 is represented in black, Participant 3 is shown in gray, and Participant 4 is represented in a striped black-and-white column. It was observed that the group consumed fewer portions during experimental sessions 1 and 4 (9 and 8 portions, respectively) compared to experimental sessions 2 and 3 (13 portions consumed in each session). This indicates that most participants consumed four more servings during experimental sessions 2 and 3 compared to experimental session 1. Then, group consumption decreased during experimental session 4, with five fewer servings. These results indicated that group consumption during experimental session 4 was lower, even lower than that during experimental session 1.
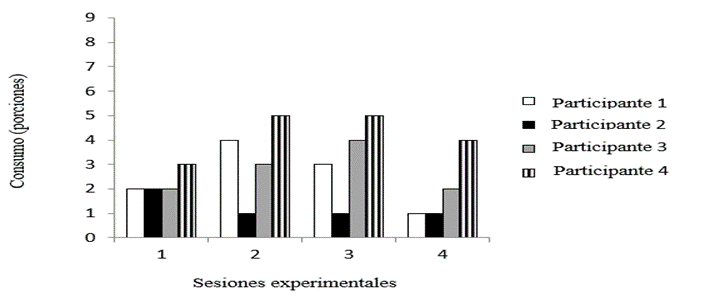
Figure 32. Total consumption of portions during the 4 sessions group 2. Successive monotony
Figure 32. It shows the total consumption of portions by each participant in the group exposed to monotonous foods successively during the four experimental sessions. The experimental session in which each consumption was made is indicated at the bottom of the graph. The vertical axis indicates the number of portions consumed. The number of participants and the corresponding color are indicated on the figure's left.
Figure 33 shows the consumption by group 3, which was simultaneously exposed to a varied diet. The experimental session in which each consumption was made is indicated at the bottom of the graph. The vertical axis indicates the number of portions consumed. The number of participants and the corresponding color are indicated on the figure's left. Participant 1 is represented in white, Participant 2 is represented in black, Participant 3 is shown in gray, and Participant 4 is represented in a striped black-and-white column. In general, it was observed that the participants consumed a similar number of portions during experimental sessions: 1 (17 portions), 2 (19 portions), and 4 (18 portions). The number of servings consumed during experimental session 3 was lower in most participants, as three consumed 1 or 2 fewer servings during experimental session 3, compared to the other experimental sessions, with the group consumption being 14 servings.
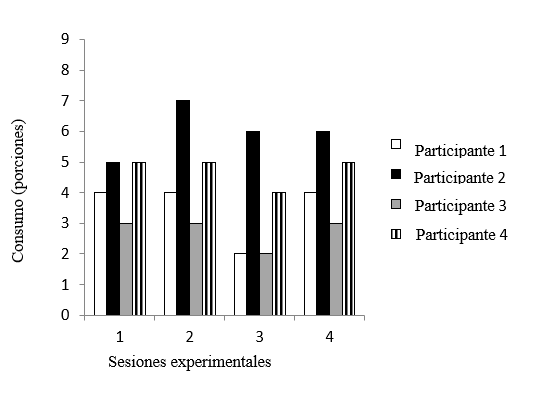
Figure 33. Total consumption of portions during the 4 sessions group 3. Simultaneous variety
Figure 33. Shows the total consumption of portions by each participant in the group exposed to varied foods simultaneously during the four experimental sessions. The experimental session in which each consumption was made is indicated at the bottom of the graph. The vertical axis indicates the number of portions consumed. The number of participants and the color corresponding to each one are indicated on the figure's left.
Finally, figure 34 shows the consumption by group 4, which was exposed to a varied diet in succession. The experimental session in which each consumption was made is indicated at the bottom of the graph. The number of servings consumed is indicated on the vertical axis. The number of participants and the color corresponding to each one are indicated on the figure's left. Participant 1 is represented in white, Participant 2 is represented in black, Participant 3 is shown in gray, and Participant 4 has a column striped in black and white. It was observed that 3 participants consumed 1 to 3 servings more in the second, third, and fourth experimental sessions than in the first session. Thus, a group consumption of 22 servings was observed in sessions 2 and 4, and 18 servings in experimental session 3, while in experimental session 1, consumption was 16 servings. In general, this indicates that the number of servings consumed was lower in experimental session one and that the highest consumption occurred during sessions 2 and 4, except for participant 1, who consumed 1 or 2 more servings in experimental session one compared to experimental sessions 2, 3 and 4.
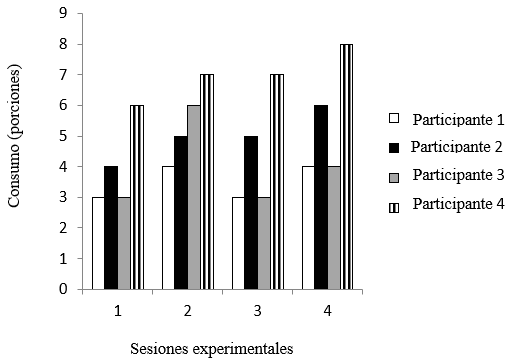
Figure 34. Total consumption of portions during the 4 sessions group 4. Successive variety
Figure 34. Shows the total consumption of portions by each participant in the group exposed to different foods in succession during the four experimental sessions. The experimental session in which each consumption was made is indicated at the bottom of the graph. The vertical axis indicates the number of portions consumed. The number of participants and the color corresponding to each one are indicated on the figure's left.
Selection latency. Intra-group analysis
Figure 35 shows the latency of food selection for group 1, which was exposed to a monotonous diet simultaneously. The experimental session in which the selection was made is indicated at the bottom of the graph. The vertical axis indicates the time in seconds of the latency of the selection made by each participant. The number of participants and the color corresponding to each one are indicated on the figure's left. Participant 1 is represented in white, Participant 2 is represented in black, Participant 3 is shown in gray, and Participant 4 has a column striped in black and white. It was observed that during the first three experimental sessions, the selection latency was between 45 and 80 seconds in most cases. However, during experimental session 4, the group reduced the selection latency to between 20 and 40 seconds. This indicates a decrease of approximately 50 % with respect to the selection latencies observed in the first three experimental sessions.
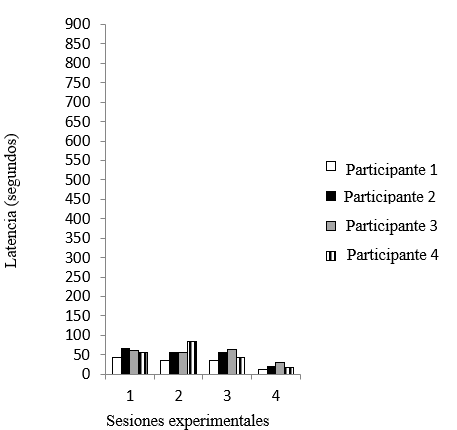
Figure 35. Selection latency during the 4 sessions group 1. Simultaneous monotony
Figure 35. It shows the latency of the selection made by each participant in the group exposed to monotonous foods simultaneously during the four experimental sessions. The experimental session in which the selection was made is indicated at the bottom of the graph. The vertical axis indicates the time in seconds of the latency of the selection made by each participant. The number of participants and the corresponding color are indicated on the figure's left.
Figure 36 shows the selection latency of the group exposed to monotonous foods in succession during the four experimental sessions. The experimental session in which the selection was made is indicated at the bottom of the graph. The vertical axis indicates the selection latency time in seconds for each participant. The participant number and the corresponding color are indicated on the figure's left. Participant 1 is represented in white, Participant 2 is represented in black, Participant 3 is shown in gray, and Participant 4 has a column striped in black and white. The group presented selection latencies of less than 50 seconds in the first two experimental sessions (between approximately 20 and 35 seconds). Subsequently, in the third experimental session, the group increased the selection latency in a general way (in 2 of the cases, it was 50 seconds and 80 seconds, respectively, while in the other 2 participants, the latency was approximately 30 seconds and 20 seconds, respectively). Finally, in the fourth experimental session, only 2 participants increased the selection latency of the portions (500 seconds and 450 seconds, respectively), compared to the other 2 participants who presented selection latencies of 40 seconds and 15 seconds, respectively.
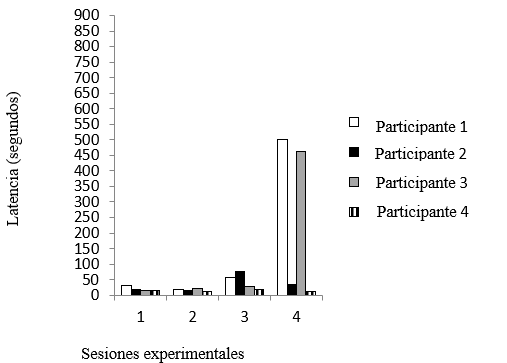
Figure 36. Selection latency during the 4 sessions group 2. Successive monotony
Figure 36. It shows the latency of the selection made by each participant in the group exposed to monotonous foods successively during the four experimental sessions. The experimental session in which the selection was made is indicated at the bottom of the graph. The vertical axis indicates the time in seconds of the latency of the selection made by each participant. The number of participants and the color corresponding to each one are indicated on the figure's left.
Figure 37 shows the latency of the selection made by each participant in the group exposed to different foods simultaneously during the four experimental sessions. The experimental session in which the selection was made is indicated at the bottom of the graph. The vertical axis indicates the time in seconds of the latency of the selection made by each participant. The number of participants and the color corresponding to each one are indicated on the figure's left. Participant 1 is represented in white, Participant 2 is represented in black, Participant 3 is shown in gray, and Participant 4 has a column striped in black and white. The selection latency of group 3 (simultaneous variety) was less than 50 seconds during experimental session 1 (between 15 and 35 seconds). During experimental session 2, the selection latency increased in all cases (between 60 and 90 seconds). Subsequently, the selection latencies performed by the group decreased progressively during sessions 3 (between 40 and 60 seconds) and 4 (between 15 and 50 seconds). This indicates that the selection latencies were lower during experimental sessions 1 and 4.
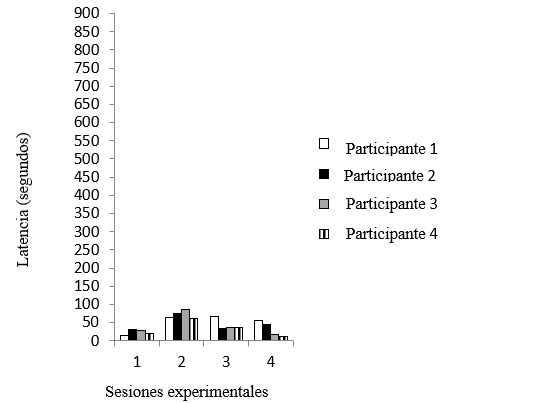
Figure 37. Selection latency during the 4 sessions group 3. Simultaneous variety
Figure 37. It shows the latency of the selection made by each participant in the group exposed to varied foods simultaneously during the four experimental sessions. The experimental session in which the selection was made is indicated at the bottom of the graph. The vertical axis indicates the time in seconds of the latency of the selection made by each participant. The number of participants and the color corresponding to each one are indicated on the figure's left.
Figure 38 shows the selection latencies of group 4, which was successively exposed to a varied diet. The experimental session in which the selection was made is indicated at the bottom of the graph. The vertical axis indicates the time in seconds of the latency of the selection made by each participant. On the figure's left is the number of participants and the color corresponding to each one. Participant 1 is represented in white, Participant 2 is represented in black, Participant 3 is shown in gray, and Participant 4 has a column striped in black and white. It was observed that the selection latencies made by the group during experimental session 1 were similar (in most cases) to those presented during experimental sessions 2 and 3 (ranging from 10 to 35 seconds). On the other hand, it was observed that the selection latency of the participants decreased during experimental session 4 (between 10 and 15 seconds) compared to the other sessions. This indicates that, in general, the group presented a lower selection latency during experimental session four compared to the first three experimental sessions.
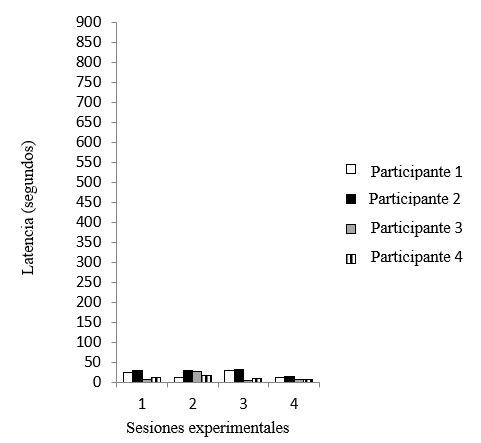
Figure 38. Selection latency during the 4 sessions group 4. Successive variety
Figure 38. It shows the latency of the selection made by each participant in the group exposed to different foods in succession during the four experimental sessions. The experimental session in which the selection was made is indicated at the bottom of the graph. The vertical axis indicates the time in seconds of the latency of the selection made by each participant. The number of participants and the color corresponding to each one are indicated on the figure's left.
Consumption latency. Intra-group analysis
Figure 39 shows the latency of food consumption for group 1, which was exposed to a monotonous diet simultaneously. The experimental session in which the consumption was carried out is indicated at the bottom of the graph. The vertical axis indicates the time in seconds of the latency of the consumption made by each participant. The number of participants and the color corresponding to each one are indicated on the figure's left. Participant 1 is represented in white, Participant 2 is represented in black, Participant 3 is shown in gray, and Participant 4 has a column striped in black and white. It was observed that during the first three experimental sessions, the consumption latency was between 45 and 80 seconds in most cases. However, during experimental session 4, the group reduced the consumption latency to between 20 and 40 seconds. This indicates a decrease of approximately 50 % with respect to the consumption latencies observed in the first three experimental sessions.
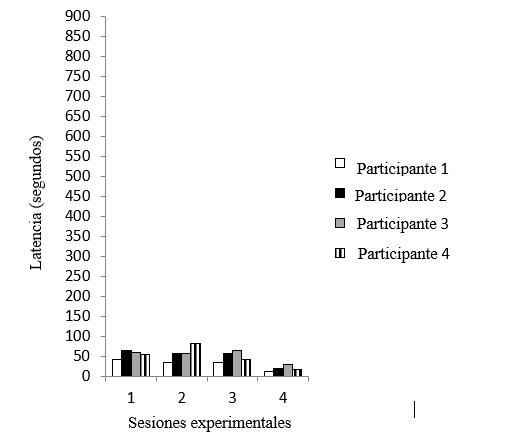
Figure 39. Latency of consumption during the 4 sessions group 1. Simultaneous monotony
Figure 39. It shows the latency of consumption by each participant in the group exposed to monotonous foods simultaneously during the four experimental sessions. The experimental session in which the consumption was carried out is indicated at the bottom of the graph. The vertical axis indicates the time in seconds of the latency of consumption by each participant. The number of participants and the color corresponding to each one are indicated on the figure's left.
Figure 40 shows the latency of consumption by each participant in the group exposed to monotonous foods successively during the four experimental sessions. The experimental session in which consumption occurred is indicated at the bottom of the graph. The vertical axis indicates the time in seconds of the consumption latency performed by each participant. On the figure's left is the number of participants and the color corresponding to each one. Participant 1 is represented in white, Participant 2 is represented in black, Participant 3 is shown in gray, and Participant 4 has a column striped in black and white. The group presented consumption latencies of less than 50 seconds in the first two experimental sessions (between approximately 20 and 35 seconds). Subsequently, in the third experimental session, the group generally increased the consumption latency (in 2 cases, it was 50 seconds and 80 seconds, respectively, while in the remaining 2 participants, the latency was 30 and 20 seconds, respectively). Finally, in the fourth experimental session, only 2 participants increased the latency of consumption of the portions (500 seconds and 450 seconds, respectively), compared to the other 2 participants who had consumption latencies of 40 seconds and 15 seconds, respectively).
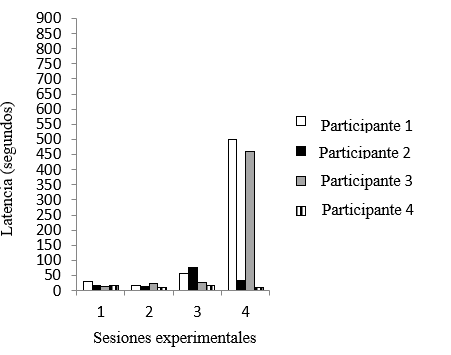
Figure 40. Latency of consumption during the 4 sessions group 2. Successive monotony
Figure 40. It shows the latency of consumption by each participant in the group exposed to monotonous foods successively during the four experimental sessions. The experimental session in which the consumption was made is indicated at the bottom of the graph. The vertical axis indicates the time in seconds of each participant's consumption latency. The number of participants and the color corresponding to each one are indicated on the figure's left.
Figure 41 shows the latency of consumption by each participant in the group exposed to different foods simultaneously during the four experimental sessions. The experimental session in which consumption occurred is indicated at the bottom of the graph. The vertical axis indicates the time in seconds of the latency of consumption by each participant. The number of participants and the color corresponding to each one are indicated on the figure's left. Participant 1 is represented in white, Participant 2 is represented in black, Participant 3 is shown in gray, and Participant 4 has a column striped in black and white. The group's consumption latency was less than 50 seconds during experimental session 1 (between 15 and 35 seconds). In experimental session 2, the consumption latency increased in all cases (between 60 and 90 seconds). Subsequently, the consumption latencies performed by the group decreased progressively during sessions 3 (between 40 and 60 seconds) and 4 (between 15 and 50 seconds). This indicates that the consumption latencies were lower during experimental sessions 1 and 4.
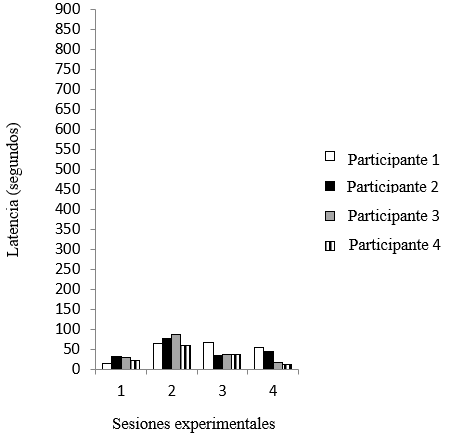
Figure 41. Latency of consumption during the 4 sessions group 3. Simultaneous variety
Figure 41. It shows the latency of consumption by each participant in the group exposed to various foods simultaneously during the four experimental sessions. The experimental session in which the consumption was carried out is indicated at the bottom of the graph. The vertical axis indicates the time in seconds of the latency of consumption by each participant. The number of participants and the color corresponding to each one are indicated on the figure's left.
Finally, figure 42 shows the latency of consumption by each participant in the group exposed to different foods in succession during the four experimental sessions. The experimental session in which consumption occurred is indicated at the bottom of the graph. The vertical axis indicates the time in seconds of the latency of consumption by each participant. To the figure's left is the number of participants and the color corresponding to each one. Participant 1 is represented in white, Participant 2 is represented in black, Participant 3 is shown in gray, and Participant 4 has a column striped in black and white. It was observed that the consumption latencies achieved by the group during experimental session 1 were similar (in most cases) to those presented during experimental sessions 2 and 3 (ranging from 10 to 35 seconds). On the other hand, it was observed that the participants decreased the consumption latency during experimental session 4 (between approximately 10 and 15 seconds) compared to the other sessions. This indicates that, in general, the group presented a lower consumption latency during experimental session four compared to the first three experimental sessions.
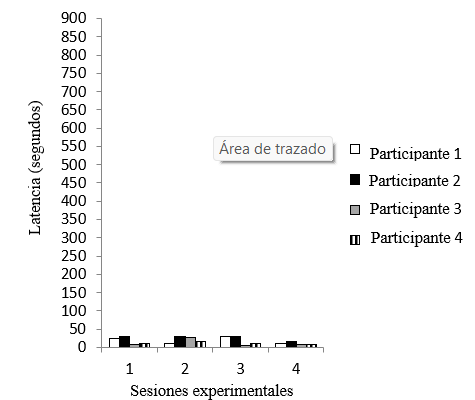
Figure 42. Latency of consumption during the 4 sessions group 4. Successive variety
Figure 42. It shows the latency of consumption by each participant in the group exposed to different foods successively during the four experimental sessions. The experimental session in which consumption took place is indicated at the bottom of the graph. The vertical axis indicates the time in seconds of the latency of consumption by each participant. The number of the participant and the color corresponding to each one are indicated on the left of the figure.
Sequence of food selection. Intra-group analysis
Table 11 shows the sequence in which the participants in Group 1 selected the monotonous foods when they were provided simultaneously on 4 different plates. It was observed that the selection of foods during the 4 experimental sessions was variable, that is, despite the fact that the foods contained the same ingredients (tomato), the participants selected portions from different plates to consume them.
|
Table 11. Sequence of food selection made by Group 1, exposed to monotonous foods simultaneously |
|||||||||
|
Experimental session |
Participant |
Sequence of food selection |
|||||||
|
1 |
1 |
P1 |
P1 |
P2 |
P3 |
|
|
|
|
|
2 |
P3 |
P3 |
P3 |
P4 |
P4 |
|
|
|
|
|
3 |
P4 |
P4 |
P4 |
|
|
|
|
|
|
|
4 |
P2 |
|
|
|
|
|
|
|
|
|
2 |
1 |
P2 |
P2 |
P1 |
P2 |
P2 |
P4 |
P1 |
|
|
2 |
P3 |
P3 |
P3 |
P3 |
P3 |
|
|
|
|
|
3 |
P4 |
P3 |
|
|
|
|
|
|
|
|
4 |
P2 |
|
|
|
|
|
|
|
|
|
3 |
1 |
P2 |
P1 |
P1 |
P1 |
P2 |
P2 |
P1 |
P2 |
|
2 |
P3 |
P3 |
P3 |
P3 |
P3 |
P3 |
P4 |
|
|
|
3 |
P4 |
P3 |
|
|
|
|
|
|
|
|
4 |
P2 |
|
|
|
|
|
|
|
|
|
4 |
1 |
P2 |
P2 |
P1 |
P1 |
P1 |
P2 |
P1 |
|
|
2 |
P3 |
P3 |
P3 |
P3 |
P4 |
P4 |
P3 |
|
|
|
3 |
P4 |
P4 |
P4 |
|
|
|
|
|
|
|
4 |
P2 |
|
|
|
|
|
|
|
|
It shows the portions of food selected by each participant in the group who was exposed to monotonous foods simultaneously. The symbols P1, P2, P3, and P4 indicate the dish from which each selected portion of food was taken. The food provided on the four plates was tomato toast.
Table 12 shows the total number of portions selected per subject, per dish, and in each experimental session. In the first experimental session, the group selected portions mostly from dish 4 (5 portions), followed by dish 3 (4 portions). In experimental session 2, the participants selected a more significant number of portions from plate 3 (6 portions), followed by plate 2 (5 portions). In contrast, during experimental session 3, they selected a more significant number of portions from plates 3 (7 portions), 2 (5 portions), and 1 (4 portions), respectively. Finally, during session 4, the group selected a more significant number of portions from dishes 3 and 4, which were in the same quantity (5 portions of each dish). It should be noted that the same number of portions were also selected from dishes 1 and 2 (4 portions). There was no significant difference in the quantities selected from dishes 1 and 2 (difference of 1 portion). In general, it was observed that during the four experimental sessions, a more significant number of portions were selected from plate 3 (22 portions in total) compared to 12 portions selected from plate 1, 16 portions selected from plate 2, and 14 portions selected from plate 4, even though the food provided was the same (tomato toast). This indicates a difference of 2 to 4 servings selected between each dish, while a difference of 10, 6, and 8 servings, respectively, was observed in comparison to the selection of dish 3.
|
Table 12. Total number of portions selected from each food dish, by Group 1 |
||
|
Experimental session |
Type of food |
Total number of servings selected by the group |
|
1 |
P1 |
2 |
|
P2 |
2 |
|
|
P3 |
4 |
|
|
P4 |
5 |
|
|
2 |
P1 |
2 |
|
P2 |
5 |
|
|
P3 |
6 |
|
|
P4 |
2 |
|
|
3 |
P1 |
4 |
|
P2 |
5 |
|
|
P3 |
7 |
|
|
P4 |
2 |
|
|
4 |
P1 |
4 |
|
P2 |
4 |
|
|
P3 |
5 |
|
|
P4 |
5 |
|
It shows the course number in which the food was provided and the total number of portions that Group 1 (exposed to monotonous food during the 4 experimental sessions) selected from each course during each experimental session.
Regarding the sequence of food selection made by Group 3 (exposed to varied foods simultaneously), no clear trend was observed during the first experimental session. However, during sessions 2, 3 and 4, most participants alternately selected slices of toast with grated tomato and slices of toast with olive oil (table 13).
|
Table 13. Food selection sequence performed by Group 3, exposed to the varied foods simultaneously |
|||||||||
|
Experimental session |
Participant |
Sequence of food selection |
|||||||
|
1 |
1 |
P1(me) |
P2(ma) |
P1(me) |
P2(ma) |
|
|
|
|
|
2 |
P4(to) |
P3(ao) |
P4(to) |
P3(ao) |
P4(to) |
|
|
|
|
|
3 |
P4(to) |
P2(ma) |
P4(to) |
|
|
|
|
|
|
|
4 |
P4(to) |
P2(ma) |
P1(me) |
P4(to) |
P3(ao) |
|
|
|
|
|
2 |
1 |
P1(me) |
P4(to) |
P1(me) |
P1(me) |
|
|
|
|
|
2 |
P3(ao) |
P4(to) |
P3(ao) |
P4(to) |
P3(ao) |
P4(to) |
P3(ao) |
|
|
|
3 |
P4(to) |
P3(ao) |
P4(to) |
|
|
|
|
|
|
|
4 |
P3(ao) |
P4(to) |
P3(ao) |
P4(to) |
P3(ao) |
|
|
|
|
|
3 |
1 |
P1(me) |
P4(to) |
|
|
|
|
|
|
|
2 |
P4(to) |
P3(ao) |
P4(to) |
P3(ao) |
P4(to) |
P3(ao) |
|
|
|
|
3 |
P4(to) |
P1(me) |
|
|
|
|
|
|
|
|
4 |
P4(to) |
P3(ao) |
P4(to) |
P3(ao) |
|
|
|
|
|
|
4 |
1 |
P1(me) |
P2(ma) |
P4(to) |
P3(ao) |
|
|
|
|
|
2 |
P4(to) |
P3(ao) |
P4(to) |
P3(ao) |
P4(to) |
P3(ao) |
|
|
|
|
3 |
P3(ao) |
P3(ao) |
P4(to) |
|
|
|
|
|
|
|
4 |
P4(to) |
P3(ao) |
P4(to) |
P3(ao) |
P4(to) |
|
|
|
|
It shows the portions of food selected by each participant who was exposed to monotonous foods simultaneously. The symbols P1, P2, P3, and P4 indicate the dish from which each selected portion of food was taken. Jam toast (me) was provided in P1, butter toast (ma) in P2, olive oil toast (ao) in P3, and tomato toast (to) in P4.
Table 13 shows the number of portions selected for each type of food during the four sessions by Group 3 during the four experimental sessions. It can be seen that during experimental session 1, the participants selected seven portions of grated tomato toast, followed by toast with butter (4 portions), olive oil (3 portions), and jam (3 portions). During experimental sessions 2, 3, and 4, the most selected foods were the grated tomato toasts (8, 7, and 8 servings) and olive oil (8, 5, and 8 servings, respectively). About jam on toast, 3, 2, and 1 servings were selected, respectively, while butter on toast was only selected during sessions 1 (4 servings) and 4 (1 serving). In general, it was observed that during the four experimental sessions, a more significant number of servings of the grated tomato (30 servings in total) and olive oil (24 servings) toasts were selected, compared to the jam (9 servings) and butter (5 servings) toasts.
|
Table 13. Type of food and total number of servings selected by Group 3, exposed to the varied foods simultaneously |
||
|
Experimental session |
Type of food |
Total number of servings selected by the group |
|
1 |
Striped tomatoes |
7 |
|
Olive oil |
3 |
|
|
Butter |
4 |
|
|
Jam |
3 |
|
|
2 |
Striped tomatoes |
8 |
|
Olive oil |
8 |
|
|
Butter |
0 |
|
|
Jam |
3 |
|
|
3 |
Striped tomatoes |
7 |
|
Olive oil |
5 |
|
|
Butter |
0 |
|
|
Jam |
2 |
|
|
4 |
Striped tomatoes |
8 |
|
Olive oil |
8 |
|
|
Butter |
1 |
|
|
Jam |
1 |
|
It shows the types of food provided to the participants in Group 3, who were exposed to various foods during the four experimental sessions. The four types of food provided and the total number of portions selected by the group in each experimental session are indicated.
Frequency of food selection:
Figure 43 shows the frequency of selection made by Group 1 (simultaneous monotony). Each color indicates the time interval between one selection and another. Interval 1 is indicated in black. White refers to interval 2. Interval 3 is shown in gray. Interval 4 is indicated with a white background and black dots, while interval five is represented with a white background and diagonal lines. Finally, white with horizontal lines refers to interval 6, and black with white dots refers to interval 7. It was observed that, for participants who made a second selection, the first interval lasted between 2 and 4 minutes. During experimental sessions 2, 3, and 4, participants who made several selections showed lower frequencies between the second and last intervals compared to the first interval. In general, variability was observed in the duration of the selection intervals made by the participants; that is to say, there is no clear trend. Similarly, it was observed that the participants made their selections during the first 15 minutes of each experimental session, regardless of the number of selections made.
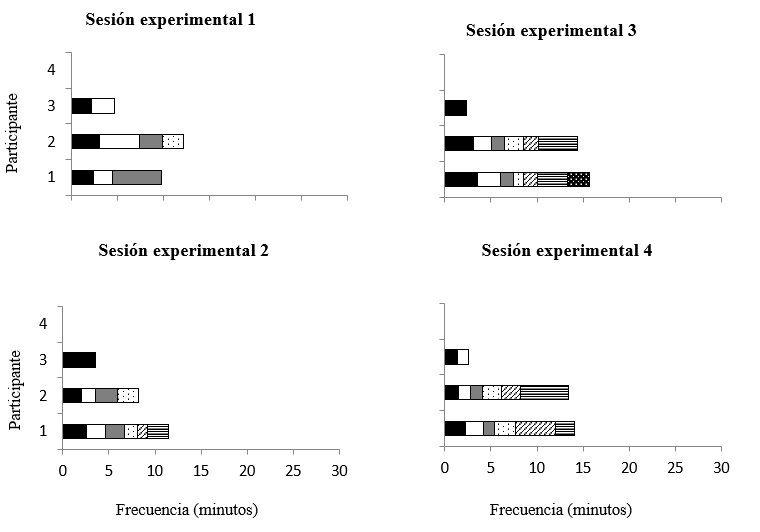
Figure 43. Frequency of selection of foods from group 1 (simultaneous monotony) during the 4 experimental sessions
Figure 43. It shows the frequency of selection of monotonous foods made by each participant in the four experimental sessions when the foods were provided simultaneously. Each color indicates the time interval between one selection and another. Interval 1 is indicated in black. White refers to interval 2. Interval 3 is shown in gray. Interval 4 is indicated with a white background and black dots, while interval five is represented with a white background and diagonal lines. Finally, white with horizontal lines refers to interval 6, and black with white dots refers to interval 7.
Figure 44 shows the frequency of selections made by Group 4 (successive monotony). Each color indicates the time interval between one selection and another. Interval 1 is indicated in black. White refers to interval 2. Interval 3 is shown in gray. Interval 4 is indicated with a white background and black dots, while interval five is represented with a white background and diagonal lines. Finally, white with horizontal lines refers to interval 6, and black with white dots refers to interval 7. It was observed that during experimental session 1, most participants only selected foods on two occasions, and the selection frequency for these participants was more significant than 5 minutes. During experimental sessions 2 and 3, at least two selection intervals were presented in most participants. Generally, the second interval was longer than the first one. These results were observed in all participants. The selection duration in the first experimental session was less than 10 minutes. In experimental sessions 2, 3, and 4, the selection duration was around 10 minutes and extended to approximately 15 minutes. In experimental session 4, the number of selections generally decreased, and the selection frequency (for participants who made a second selection) was variable.
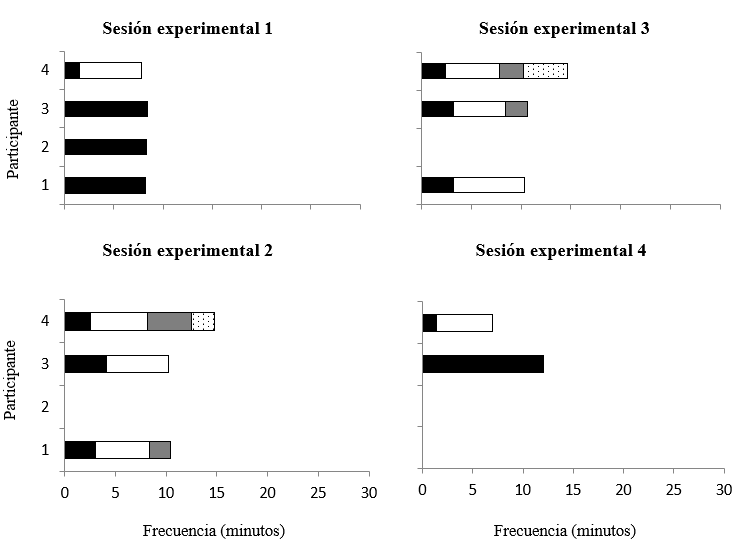
Figure 44. Frequency of selection of foods from group 2 (successive monotony) during the 4 experimental sessions
Figure 44. It shows the frequency of selection of monotonous foods made by each participant in the four experimental sessions when they were provided successively. Each color indicates the time interval between one selection and another. Interval 1 is indicated in black. White refers to interval 2. Interval 3 is shown in gray. Interval 4 is indicated with a white background and black dots, while interval five is represented with a white background and diagonal lines. Finally, white with horizontal lines refers to interval 6, and black with white dots refers to interval 7.
Figure 45 shows the frequency of selection made by Group 3 (simultaneous variety). Each color indicates the time interval between one selection and another. Interval 1 is indicated in black. White refers to interval 2. Interval 3 is shown in gray. A white background with black dots indicates interval 4, while a white background with diagonal lines represents interval five. Finally, white with horizontal lines refers to interval 6, and black with white dots refers to interval 7. It is shown that, in general, the participants made more than two selections in each experimental session. Notably, during experimental sessions 3 and 4, two participants selected two portions on several occasions with a very short interval between each selection (less than 5 seconds). It was observed that in the first two experimental sessions, the duration of the selections was around 15 minutes or less. On the other hand, during experimental sessions 3 and 4, the selection duration was less than 15 minutes in all cases.
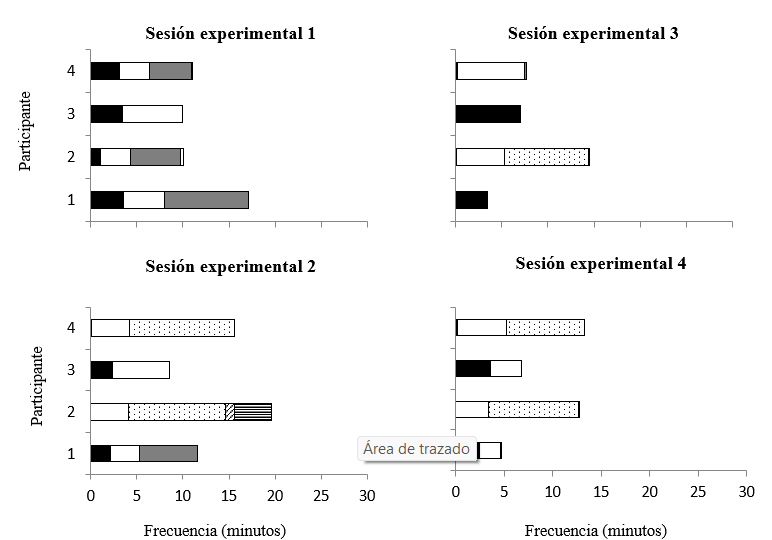
Figure 45. Frequency of selection of foods from group 3 (simultaneous variety) during the 4 experimental sessions
Figure 45. It shows the frequency of selection of different foods by each participant in the four experimental sessions when the foods were provided simultaneously. Each color indicates the time interval between one selection and another. Interval 1 is indicated in black. The color white refers to interval 2. Interval 3 is shown in gray. Interval 4 is indicated with a white background and black dots, while interval five is represented with a white background and diagonal lines. Finally, white with horizontal lines refers to interval 6, and black with white dots refers to interval 7.
Finally, figure 46 shows the selection frequency made by Group 4 (successive variety). Each color indicates the interval of time elapsed between one selection and another. Interval 1 is indicated in black. White refers to interval 2. Interval 3 is shown in gray. Interval 4 is indicated with a white background and black dots, while interval five is represented with a white background and diagonal lines. Finally, white with horizontal lines refers to interval 6, and black with white dots refers to interval 7. It was observed that most participants made more than three selections during the four experimental sessions. The selection intervals of experimental sessions 2 and 3 were shorter compared to experimental sessions 1 and 4. In general, it was observed that most participants maintained the selection behavior after 10 minutes of each experimental session, and in some cases, the selection was extended between 20 and 25 minutes during experimental session 4.
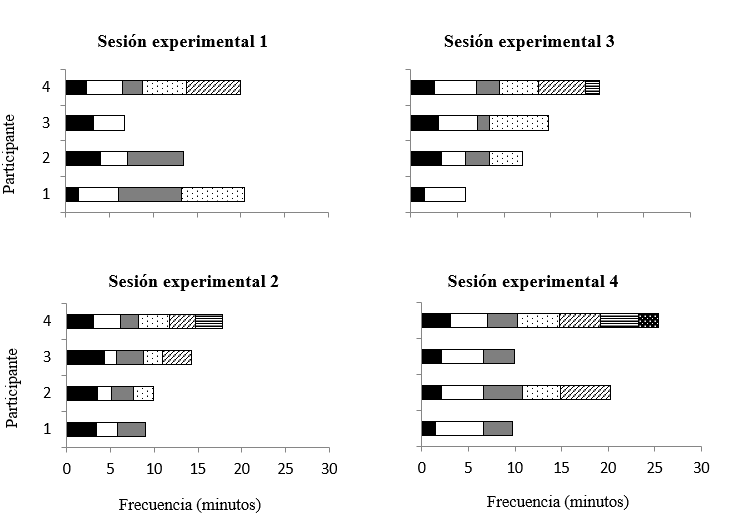
Figure 46. Frequency of selection of foods from group 4 (successive variety) during the 4 experimental sessions
Figure 46. It shows the frequency of selection of different foods by each participant in the four experimental sessions when they were provided successively. Each color indicates the time interval between one selection and another. Interval 1 is indicated in black. The color white refers to interval 2. Interval 3 is shown in gray. Interval 4 is indicated with a white background and black dots, while interval five is represented with a white background and diagonal lines. Finally, white with horizontal lines refers to interval 6, and black with white dots refers to interval 7.
Selection and consumption. Intra-group analysis
In tables 14 and 15, it can be seen that Group 1 (simultaneous monotony) selected and consumed 64 portions, and Group 2 (successive monotony) consumed 43 portions. On the other hand, Group 3 (simultaneous variety) selected and consumed 68 portions, and Group 4 (successive variety) selected 84 portions and consumed 78 portions. This indicates that the groups exposed to varied foods selected and consumed a greater quantity of food (4 and 35 servings) compared to the groups exposed to monotonous foods, regardless of whether the foods were provided simultaneously or successively. On the other hand, it was observed that the group exposed to monotonous foods simultaneously selected and consumed 21 more servings than the group exposed to foods successively. While the group exposed to varied foods successively selected and consumed 10 more servings than the group exposed to varied foods simultaneously.
|
Table 14. Number of portions selected by the groups during the experimental sessions and total number of portions selected during the experiment |
|||||
|
Group and experimental condition |
Number of portions selected in each experimental session |
Total number of portions selected during the experiment |
|||
|
Session 1 |
Session 2 |
Session 3 |
Session 4 |
||
|
Group 1. Simultaneous monotony |
13 |
15 |
18 |
18 |
64 |
|
Group 2. Successive monotony |
9 |
13 |
13 |
8 |
43 |
|
Group 3. Simultaneous variety |
17 |
19 |
14 |
18 |
68 |
|
Group 4. Successive variety |
18 |
22 |
20 |
22 |
82 |
|
Table 15. Number of portions consumed by the groups during the experimental sessions and total number of portions consumed during the experiment |
|||||
|
Group and experimental condition |
Number of portions selected in each experimental session |
Total number of portions selected during the experiment |
|||
|
Session 1 |
Session 2 |
Session 3 |
Session 4 |
||
|
Group 1. Simultaneous monotony |
13 |
15 |
18 |
18 |
64 |
|
Group 2. Successive monotony |
9 |
13 |
13 |
8 |
43 |
|
Group 3. Simultaneous variety |
17 |
19 |
14 |
18 |
68 |
|
Group 4. Successive variety |
16 |
22 |
18 |
22 |
78 |
Comparison between the selection and consumption of food by the four experimental groups during the four experimental sessions:
In experimental groups 1, 2, and 3, it was observed that food consumption during the four experimental sessions was equivalent to the number of portions selected by each participant and each group. In contrast, in experimental group 4, successively exposed to the variety, it was observed that in experimental sessions 1 and 3, some participants selected foods but did not consume them. The group consumed the selected foods during experimental sessions 2 and 4 (table 14 and table 15).
Discussion
The main results of Experiment 3 were consistent with the results obtained in Experiment 2. The groups exposed to a varied diet selected and consumed more food than those exposed to the monotonous diet, regardless of whether the food was provided simultaneously or successively. This is consistent with what has been reported in different studies that sensory satiety is specific to foods previously consumed in a meal and that have similar sensory characteristics (monotonous diet). Therefore, presenting foods with different sensory characteristics will encourage greater consumption of food (Armitage, Hervey, Rolls, Rowe & Tobin, 1983; Barber, Viña, Viña & Cabo, 1985; Booth, 1987; Hetherington & Rolls, 1996; Johnson & Vickers, 1993; McCrory et al., 1999; Ramírez, 1987; Raynor & Epstein, 2001; Rolls, 1993; Rolls, Rowe, Rolls, Kingston, Megson, & Gunary, 1980).
On the other hand, Rolls (1993) and Rolls, Rowe, Rolls, Kingston, Megson, & Gunary (1980) pointed out that the presentation of a varied diet simultaneously (similar to a buffet) encourages appetite and, therefore, consumption will be more significant compared to when a monotonous diet is presented or when the varied diet is presented successively (as in a meal served in different courses and at other times). This effect was not observed in this experiment since the group exposed to monotonous foods simultaneously selected and consumed more portions than the group exposed to foods successively. In contrast, the group exposed to varied foods successively selected and consumed more portions than the group exposed to varied foods simultaneously. This could be due to the participants' satiety or the study's novelty.
In experimental groups 1, 2, and 3, it was observed that food consumption during the four experimental sessions was equivalent to the number of portions selected. The participants in each group selected a portion, and once selected, they consumed it immediately. This explains why the selection and consumption latency were similar in all the experimental phases. On the other hand, in experimental group 4, successively exposed to the variety, it was observed that in experimental sessions 1 and 3, some participants selected foods but did not consume them. During experimental sessions 2 and 4, the group consumed the chosen foods.
In general, it was observed that in most cases and during all experimental sessions, the latencies of selection and consumption were more significant in the groups exposed to the food simultaneously compared to the groups exposed to the food successively. This was observed regardless of the type of diet provided. This data could be because the participants were not given a specific time to consume each of the portions, and they decided when to select and consume the food based on their hunger and/or satiety level.
On the other hand, it was observed that in the groups exposed to the varied diets, the latencies of selection and consumption decreased progressively between one experimental session and another. This data could indicate that by having access to a diet with diverse ingredients and knowing the diet content in advance, the participants selected the foods they preferred quickly and consumed them immediately. However, no studies have addressed this issue.
About the groups exposed to the monotonous diet, it was observed that in most cases, latencies were longer in the group exposed to food simultaneously, in contrast to the latencies of the group exposed to the monotonous diet successively. This was observed during most of the experimental sessions and in most participants. This could be because, as mentioned above, the participants decided when to select and consume the food based on their hunger and/or satiety, as no specific time was set for this. Alternatively, it could be due to the effect of food monotony; since the identical diets were provided during four experimental sessions (or for more extended periods), the participants showed a decrease in their preference for these foods and consequently avoided or postponed the consumption of food until it was possible for them to obtain other foods or until hunger induced them to consume the available food (Rolls, 1993; Rolls & de Waal, 1985).
Another critical piece of data to analyze is related to the variability in the frequency of selection and consumption of food, as well as in the duration of consumption, observed in all groups. Rolls (1993) pointed out that the long-term effects produced by monotonous foods persist between meals and even from day to day. He also indicated that these long-term effects could be due to cognitions (i.e., knowledge about a recently consumed food and the memory of its sensory properties). Because of this, it is likely that the participants, seeing that the foods were the same and would have free access to them or that the same food would be presented at subsequent intervals, decided when they would consume the portions and not from the beginning.
Regarding the sequence of food selection made by the groups exposed simultaneously, it is worth noting that the participants were exposed to a monotonous diet and selected foods from different dishes even when they contained the same ingredients. Concerning the selection of food by the group exposed to the varied diet, it was observed that the participants preferred food with combinable sensory characteristics, that is, food that allowed for greater variety in flavors. These results can be explained if we return to Rolls' (1993) argument that individuals usually consume food trying to maintain palatability in a meal. Therefore, the order in which food and drink are consumed would aim to preserve oropharyngeal stimulation. A probable explanation for the data obtained in our study would be related to the fact that the individuals consumed food from different plates, trying to make their meals more varied, even when they identified that the food contained the same ingredients. It is also important to point out that there is no trend in the selection sequence, mainly due to the participants' individual preferences and not so much to the effects of the SSE (Rolls, 1993).
Regarding the frequency of food selection, it was observed that the groups exposed to the varied diet made selections more frequently and that the selection duration was longer than those exposed to the monotonous diet. This was observed in all the participants. In contrast, in the groups exposed to monotonous diets, more significant variability was observed; that is to say, half of the participants, or at least one, did not make selections frequently and presented food selection with short duration. More excellent stability was observed in the durations and frequencies of the successive variety group.
On the other hand, in terms of the groups exposed to the monotonous diets, it was observed that the successive monotony group presented more excellent uniformity in the selections; that is to say, the majority of the participants presented short durations and similar results among themselves, in comparison with the group exposed to the monotonous diet simultaneously, who selected the foods with variable frequencies and in some cases presented long durations and in others very short ones.
The above is consistent with the report by Rolls, Rowe, Rolls, Kingston, Megson & Gunary (1981) and Rolls, Rowe & Rolls (1982), who pointed out that SSE occurs with food previously consumed during a meal. Therefore, offering a variety of food keeps the appetite longer than when monotonous food is consumed. In this case, the quantity of food selected and consumed will be less, and consumption will occur over a shorter period.
Finally, it can be concluded that in this experiment, as in the previous one, exposure to monotonous and varied diets, as well as the way they were presented, influenced the selection and consumption of food, affecting the latency, frequency, sequence, and duration of consumption (Raynor & Epstein, 2001).
DISCUSSION
The main results obtained in the experiments carried out were:
1. In all 3 experiments, the SSS was presented in the form of monotonous diets, inducing a lower consumption of food within each experimental phase or session.
2. When the groups were provided with varied diets, there was a higher consumption of food within each experimental phase or session.
3. The groups exposed to varied diets selected and consumed a greater number of portions than those exposed to monotonous diets, regardless of whether the food was provided simultaneously or successively.
4. No clear trend was observed regarding the effects of presenting the diets simultaneously or successively. However, the way the food was presented did influence the different parameters analyzed (quantity, latency, frequency, sequence, and duration).
5. Participants exposed to monotonous diets simultaneously selected and consumed foods from different dishes, even when the portions contained the same ingredients.
6. The sequence of food selection made by the groups exposed to the diets simultaneously did not show a clear trend.
7. No apparent effects were observed in the frequency of selection and duration of food consumption by all experimental groups.
The analysis of these findings will be explored in more depth below.
Firstly, the data obtained in the experiments suggested that SSE influenced the selection and consumption of each experimental group's monotonous and varied diets. Specifically, it was observed that the groups exposed to the bland diet selected and consumed a smaller quantity of food than those exposed to the varied diet, independently of whether the food was provided simultaneously or successively. These findings coincide with those obtained by other researchers (Armitage, Hervey, Rolls, Rowe & Tobin, 1983; Barber, Viña, Viña & Cabo, 1985; Booth, 1987; Hetherington & Rolls, 1996; Johnson & Vickers, 1993; McCrory et al., 1999; Ramírez, 1987; Raynor & Epstein, 2001; Rolls, 1993; Rolls, Rowe, Rolls, Kingston, Megson, & Gunary, 1980). For example, we can mention the study by Rolls, Rowe, Rolls, Kingston, Megson, and Gunary (1981). These authors conducted three experiments in which food was provided in monotony and in a variety of conditions to assess SSE's effect on food consumption. The results showed that the presentation of a variety of foods in succession during a meal increases the consumption of these foods. In particular, this result is comparable to that of the present research since the selection and consumption of food by the groups exposed to the varied diet were more significant than those exposed to the monotonous diet.
Unlike the findings of Rolls and his collaborators (1981), differences were observed in the different parameters evaluated within each group in this work. No clear trend was observed in the latency of selection and consumption, in the sequence and frequency of selection, or the duration of consumption. Pinel (2007) pointed out that human beings' culture, working hours, family routines, personal preferences, and economic situation, among other factors, determine the time, duration, and frequency of food consumption. Because of this, it is considered that the TSSE can only partially explain the effects observed in the experiments reported in this paper.
Rolls (1993) stated that the pleasant taste of food is only one of the elements involved in selecting and consuming food. He also pointed out that these behaviors can also be moderated by physiological states such as hunger and satiety, psychological elements such as preference, beliefs, and other sociocultural factors related to food (Hetherington & Rolls, 1996; Rolls, 2007; Rolls, Rolls, Rowe & Sweeney, 1981).
Rolls (1993) also pointed out that SSE has little impact on food consumption when only one type of food is available and hunger persists. This could have occurred in experiment 1, in the sameness-sameness group, which consumed similar amounts during both experimental phases. Another explanation could be related to the data reported in different experiments, in which it has been proven that SSS only shows its effects in a single meal and that the long-term effects observed could be mainly related to cognitive aspects such as beliefs and total satiety, in addition to sensory satiety (Hetherington, 1996; Rolls, Rolls, Rowe & Sweeney, 1981).
Regarding the selection sequence, Rolls (1993) pointed out that individuals usually consume food to maintain palatability in a meal. Therefore, the order in which food and drink are consumed would aim to preserve oro-pharyngeal stimulation. This could explain why, in experiments 2 and 3 of the present research, participants exposed to monotonous diets simultaneously selected portions from different dishes even when the foods contained the same ingredients, which could suggest that they were trying to make their diet more varied. In addition, as an anecdotal fact, it is interesting to mention that in the groups exposed to the monotonous diet, the participants commented that the ingredients of the dressing used were different and therefore, they selected and consumed portions of different dishes; however, the dressing contained the same ingredients. As mentioned in previous discussions, it is essential to point out that there is no trend in the selection sequence, which could be due to the participants' individual preferences and not so much to the effects of the SSE (Rolls, 1993).
On the other hand, it was observed that the participants in experiment 2 who were exposed to varied diets simultaneously showed a preference for chicken and jam sandwiches. In contrast, in experiment 3, a preference was observed for slices of toast with tomato and olive oil. This could suggest that the participants consumed a greater quantity of food because the food was probably to their liking and was available, and not necessarily because of the presence of variety. Rolls (1985; 1993) and Rolls, Rowe, Rolls, Kingston, Megson, & Gunary (1980) pointed out that it is difficult to interpret the results of studies that use the simultaneous presentation of foods as the effects that the variety of foods has on the selection and consumption of these foods can be confused with the impact that the availability of a preferred food has. Therefore, they do not consider it an adequate method to measure the effects of variety and SSE, as there is no explicit experimental control. Because of this, it is deemed necessary that in subsequent studies, a food preference test be carried out before starting the experimental studies so that this variable can be controlled and does not affect the evaluation of the effects of SSE.
Regarding how food is presented in studies, it has been stated that the successive presentation of food is more appropriate than simultaneous presentation when the objective of the research is to evaluate the effect of variety on food consumption. It has also been reported that there will be greater consumption when varied foods are presented simultaneously and that the quantity of food can be controlled when food is provided successively (Raynor & Epstein, 2001; Rolls, Rolls, Rowe & Sweeney, 1981). However, in the series of experiments carried out in this research, in the groups exposed to monotonous foods simultaneously, the effect indicated by Rolls and his collaborators (1981) was observed since the participants selected and consumed more food than the group successively exposed to foods. In contrast, the group exposed to varied foods in a consecutive manner selected and consumed a greater quantity than the group exposed to varied foods simultaneously.
In this regard, no studies were found that clearly explain these data, so it is suggested to carry out studies in which the same participants are exposed to the presentation of food both simultaneously and successively to find regularities in behavior, which can also be complemented by measuring the parameters of latency, frequency, and duration, to delve deeper into the effects that could occur in them, not only in the amount of food selected and consumed. It is also suggested that the participants be exposed to the experimental conditions individually and not in groups, as it is considered that there can be greater experimental control of the variables, and the probability of their influencing each other's behavior would be eliminated.
On the other hand, in experiments 2 and 3 of this research, it was observed that the groups exposed to the varied diet selected and consumed more portions than those exposed to the monotonous diet in succession. These data are consistent with the report by Raynor & Epstein (2001), who pointed out that individuals exposed to successively varied diets show a higher consumption than individuals exposed to a successively monotonous diet. This indicates that the effects of SSS and variety are more clearly observable when this type of food presentation is used (Rolls, Rowe, Rolls, Kingston, Megson, & Gunary, 1980).
Among the anecdotal data, it is worth mentioning the fact that in Experiment 3, some participants exposed to varied diets simultaneously took tomato and olive oil on toast and ate them like a baguette, trying to combine the ingredients, as in their culture, it is common to eat food in this way. In addition, it was observed that the participants who were exposed to the monotonous diets made various comments, stating, "I could eat more if I had more drink," "The sandwiches are delicious, but if they had other ingredients, like chili and vegetables, it would be better"; "is it necessary for me to eat here? ... I'm going to eat something, but when I leave I'm going to buy something different". This could be related to what has been pointed out in some studies regarding the fact that people consume the food available to them, induced by the state of hunger in which they find themselves, or they will avoid or postpone the consumption of food until it is possible for them to get other types of food, as well as exhibiting different behaviors that allow them to find a series of foods that provide them with greater oropharyngeal stimulation (Rolls, 1993; Rolls & de Waal, 1985).
Additionally, in the theoretical framework of this document, it was indicated that most studies on SSE use verbal or written reports on the acceptability of food (the pleasure and liking or disliking according to the sensory properties) and appetite (desire to continue eating), to identify the main characteristics or effects of this food phenomenon. In addition, reports are made on the hunger and satiety states of the participants, before and after exposure to the food (Guinard & Brun, 1998; Hetherington, 1996; Hetherington, Foster, Newman, Anderson & Norton, 2006; Hetherington & Rolls, 1996; Hetherington, Rolls & Burley, 1989; McCrory, et al., 1999; Rolls, 1985; Rolls & McDermott, 1991; Rolls, Rolls, Rowe & Sweeney, 1981; Rolls, van Duijvenvoorde & Rolls, 1984; Smeets & Westerterp-Plantega, 2006; Snoek, Huntjens, van Gemert, de Graaf & Weenen, 2004).
For example, we can mention the experiment carried out by Hetherington (1996), in which he evaluated the main reasons or motives for which the participants consumed food, as well as why they finished their consumption. The participants had free access to the food, and at the end of the consumption period, they indicated the main reasons why they stopped eating based on seven statements or basic arguments provided in writing, which they should organize according to their criteria and experience. The results showed the following principal reasons: 1) "I got tired of those foods"; 2) "I felt satisfied"; 3) "All the food was finished,"; and 4) "The food tasted less pleasant." In this study, the number of calories consumed by the people who gave the first two reasons was also measured to compare the information. Finally, it was observed that the participants who indicated that their main reason was feeling tired of the food consumed a significantly lower quantity than those who said they felt satisfied.
In this respect, in the present investigation, different comments made by the participants during the three experiments were identified, although these were not evaluated. The initial comments were related to the states of hunger and satiety, such as the ingredients of the food and other characteristics of the food (including the drink), the amount of food they commonly consume, the preference for consuming different foods at the end of the experimental sessions, the place where the consumption took place, the time they had to spend in front of the food, the time of day at which they commonly eat food, as well as inferences about what they would consume in the remaining experimental sessions. As the experiment progressed, the participants' comments focused on topics related to academic, work, and family activities, as well as personal preferences not associated with food. These behaviors were observed in all the groups evaluated.
Based on these elements, it is suggested that in subsequent studies (in addition to selection and consumption behaviors), a detailed record and analysis be made of the participants' verbalizations regarding the food provided, as well as the linguistic interactions between group members that arise around food, specifically about varied and monotonous diets and the effects they produce on each individual. The above could provide data confirming or refuting the observed and measured behaviors. In this way, more excellent reliability and objectivity of the aspects evaluated would be obtained, in addition to identifying other psychological factors involved in this behavior.
Another interesting comment in the groups exposed to monotonous diets was: "I could eat more if I had more to drink, even if it was flavorless water." Rolls, Rolls, and Rowe (1983) pointed out that the SSS that arises when faced with food does not affect the thirst that the person experiences. That is to say, even if an individual is complete from food, they can still drink. On the other hand, the authors pointed out that the SSS achieved when faced with a drink does not influence individuals' selection and consumption of food. Regarding this element, Rolls (1993) also reported that introducing beverages instead of consuming monotonous diets could lessen the effects observed by the SSE and that people usually consume food and drink in a different order, trying to maintain palatability in a meal. These data could explain what the participants referred to in the experiments presented in this research.
Based on this data, experiments should be carried out to evaluate the behavioral effects of SSE on beverages and the interaction between the behavioral effects produced by SSE on food and drink. Since few documents have been found, these studies would enrich the research on SSE and its relationship with beverages, especially the experimental analysis of eating behavior in the face of SSE.
Another element to discuss is the type of diets used. In the varied diet, foods with different ingredients were presented (different textures, different flavors, but with a similar appearance (shape)), as the aim was to keep some elements the same to maintain greater control of the variables. Although higher consumption was observed in the groups exposed to varied diets, there were no significant differences in food selection and consumption. This could be because the participants did not consider there to be any significant variation between the sensory characteristics of the food provided, so it is possible that at some point, the varied diet was perceived as monotonous. These data are consistent with what has been pointed out in some studies regarding the fact that if the sensory characteristics of the foods presented in a meal are very similar, the increase in consumption will not occur (Raynor & Epstein, 2001; Rolls, Rowe & Rolls, 1982a; Rolls, Rowe & Rolls, 1982b). For example, in an experiment by Rolls, Rowe, and Rolls (1982b), participants were successively given three flavors of yogurt, similar in color and texture, on three occasions. The authors did not observe any increase in the consumption of this food in subsequent sessions. The same effect was observed when chocolates had a similar appearance and texture but a different flavor, shape, aroma, and color.
The participants in this study went so far as to say: "The sandwiches are delicious, but could you also bring us some tacos?"; "Could you bring us other foods for breakfast instead of toast, eggs, for example?". Based on this data, it is essential to carry out studies using foods with a greater variety of sensory characteristics. In contrast, the monotonous diet could contain fewer ingredients and similar sensory characteristics. This is suggested because the more significant the array in the sensory attributes of the food, the greater the stimulation (Raynor & Epstein, 2001; Rolls, 1985; Rolls, 1993; Rolls, Rowe & Rolls, 1982a; Rolls, Rowe, Rolls, Kingston, Megson & Gunary, 1981).
Due to the above, it could be evaluated even more reliably that satiety occurred due to saturation or SSE (in the case of monotonous diets) and that variety had an essential influence on the acceptance and consumption of food (Raynor & Epstein, 2001; Rolls, Rolls, Rowe & Sweeney, 1981). Based on the above, it could be pointed out
The reference to anecdotal data suggests that the methodology used was not sensitive to identifying variables associated with morphology, even when such elements were present. In this regard, López-Espinoza (2007, pp. 258) pointed out that "one of the greatest challenges for the study and experimental analysis of eating behavior has been the design of reliable methods to record each of its parameters." He also pointed out that video recordings are tools that facilitate the recording of specific behaviors within the "Microstructural Analysis of Eating Behavior and the Behavioral Sequence of Satiety," both in animals and in humans (López-Espinoza, 2007, p. 261). In addition to recording specific eating behaviors, computer programs developed for their analysis would allow for the analysis of a more significant number of behaviors related to the selection and consumption of monotonous and varied diets. Based on the above, it is suggested that other procedures be implemented or included that allow, in addition to recording behavioral morphology, the identification of different elements that are interdependent in the occurrence of eating behaviors of selection and consumption in humans, specifically of monotonous and varied diets and their relationship with SSE.
Probably, a program for the analysis of behavior that would help to solve this problem is the so-called "The Observer XT" (www.noldus.com), which is used as a research tool in different disciplines since it allows for precise and quantitative behavioral coding and analysis records time automatically and accurately, gathers extensive and significant data regarding the behavior studied, and provides for reliable statistical calculation of the requested data.
On the other hand, the behavioral methodology proposed in this research is not frequently used in studying the selection and consumption of monotonous and varied diets and SSS in humans. This could be because eating has been considered a complex phenomenon related to psychological, physiological, and anthropological variables to a greater extent, and methodologies are used to analyze all these elements simultaneously. However, using methods such as the one proposed in this work allows us to evaluate the selection and consumption behaviors of monotonous and varied foods and their relationship with SES precisely and independently of other intervening factors. This is important because, as Martínez, López-Espinoza, Aguilera, Galindo, and De la Torre-Ibarra (2007) point out: "much of current scientific research is carried out in the laboratory because that is where the greatest number of variables can be controlled through technological applications." Additionally, López-Espinoza (2007) indicated that the role of the experimental psychologist is essential in developing technology that allows for the adequate characterization of the food phenomenon. Consequently, the controlled study of eating behavior provides critical elements to explain behaviors observed in natural environments. In this way, fundamental analyses can be carried out for the development of technologies or programs that allow us to solve health problems related to the way we feed ourselves and that still do not have an adequate answer, as well as providing strategies for their prevention (López-Espinoza, 2007).
Among the main health problems related to eating behavior are those related to metabolic (such as obesity) and psychological aspects, including anorexia nervosa and bulimia nervosa (American Psychiatric Association, 2005; Raynor & Epstein, 2001; Rolls, 1985; 1993; Rolls, Rowe & Rolls, 1982a; Rolls, Rowe & Rolls, 1982b).
Regarding obesity, it has been suggested that access to a wide variety of foods may be an essential factor in the overconsumption of food and, therefore, in the high incidence of obesity and other abnormal eating behaviors observed, especially in Western societies (Rolls, 1993; Rolls, Rowe, Rolls, Kingston, Megson & Gunary, 1980).
Anorexia nervosa refers explicitly to a loss of appetite and is reflected in a lower consumption of food. On the other hand, bulimia nervosa refers to an extraordinarily high and unusual appetite that is reflected in a large consumption of food in a short period, even when total satiety has been reached (Herman & Polivy, 1996). About these health problems one of the benefits of analyzing the basic mechanisms involved in SSS could be related to the different applications that the theory could have in addressing these problems. For example, improvements in the diet of those suffering from anorexia nervosa could be proposed: given that continuous stimulation of the palate makes it possible to select a varied diet, it is possible to increase the taste and consumption of diets with an adequate balance of nutrients, allowing subjects to maintain an appropriate weight and state of health. Therefore, varying the daily diet will help to increase the consumption of nutritious foods. It will reduce the possibility of consuming foods that affect patients' health and influence the disorder's maintenance (Rolls, Rolls, Rowe & Sweeney, 1981; Foote, Murphy, Wilkens, Basiotis & Carlson, 2004).
On the other hand, regarding obesity and bulimia, the development of eating programs that contemplate low sensory stimulation and, therefore, influence a lower food consumption or a decrease in it can be suggested (Rolls, Rolls, Rowe & Sweeney, 1981).
Becoña, Vázquez, and Oblitas (2004) and the Regional Government of Andalusia (2002-2007) suggested some strategies to control over-eating behavior in tobacco addicts. It is considered that these strategies could also be efficient in the disorders mentioned above and that they could well be related to the parameters studied in this thesis. For example, regarding food, it is considered that monotonous diets or diets with a reduced number of sensory characteristics could be provided. Additionally, Becoña, Vázquez, and Oblitas (2004) and the Regional Government of Andalusia (2002-2007) suggest regulating portions and leaving a small amount of food on each plate. This would reduce the quantity and availability of food.
Another helpful recommendation would be to provide food separately (that is, successively) and not to give a new plate of food without having removed the previous plate (Becoña, Vázquez & Oblitas, 2004; Junta de Andalucía, 2002-2007). This strategy will reduce sensory stimulation and, therefore, the excessive consumption of food that occurs at buffet-style meals.
Regarding the sequence of food selection and consumption, it is suggested that the preferred food should always be consumed first, leaving the less preferred foods for last (Becoña, Vázquez & Oblitas, 2004; Junta de Andalucía, 2002-2007).
The latency of consumption should be increased regardless of the diet provided. That is to say, wait a few minutes to eat from when the sensation of hunger is felt. It would also be helpful to establish a frequency of consumption, waiting a few minutes before consuming the next food, and establishing a specific time for the total consumption of the diet (duration of consumption) (Becoña, Vázquez & Oblitas, 2004; Junta de Andalucía, 2002-2007).
Of course, it is essential to bear in mind that these eating disorders are complex. Hence, the ideas outlined above are only suggestions about the applications that the information obtained in these experiments and the line of research, in general, could have. Furthermore, they would only address part of the spectrum even if their application were viable. Consequently, it would be necessary to carry out a more detailed and in-depth analysis of the application of these findings for the understanding and modification of the problems, in addition to considering complementary treatments (medical, psychiatric, psychological, nutritional, dental, activation, and physical conditioning management, among others), to provide multidisciplinary care for eating disorders (Fernández, 1998; Unikel & Caballero, 2010).
CONCLUSIONS
The findings of this research, based on the analysis of the parameters of the selection and consumption behaviors of varied and monotonous diets in relation to SSE, suggest that there is no general behavioral morphology but rather that there are individual differences with respect to these behavioral parameters, given the psychological and/or cultural aspects. Furthermore, the TSSE does not consider these cultural aspects in its proposal to explain why people stop eating or consume more food, depending on the sensory characteristics of the food. Due to the above, it is considered necessary to carry out experiments that allow for the individual analysis of the morphology of eating behavior, considering a methodology that also allows for the evaluation of the cultural elements that can influence the selection and consumption of food and the variations in the latency, frequency, sequence, and duration of these eating behaviors.
Based on this analysis, it can be concluded that SSS influences the selection and quantity of food consumed. However, the latency, frequency, sequence, and duration of these behaviors may be influenced not only by the SSS but also by other physiological, psychological, and sociocultural factors of each participant (Rolls, 1993).
It is important to emphasize that these elements had not been studied before in human populations using the methodology proposed here. Because of this, it is considered that the research carried out could be a small contribution to the Experimental Analysis of Eating Behavior since behavioral parameters such as latency, frequency, and sequence of food selection were evaluated, as well as the amount of food consumed and duration of consumption of the participants in relation to the variety or monotony of the food with the consumption of food. On the other hand, some limitations of the study are recognized, and this is why some suggestions are made for further studies, in which the following aspects could be considered:
1. Carry out the experiments using the same methodology, adding a control group or adding a pre-test experimental session that allows for the evaluation or ruling out of the presence of preferred foods and that this may influence the selection and consumption of these, as well as the behavioral parameters studied in the present research.
2. Add an experimental session at the end of the four sessions proposed in this work, in which the experimental condition to which the participants were exposed is changed, with the aim of assessing the effects of SSE and the monotony or variety of the food.
3. To carry out intra-subject experimental designs in which individual analysis of behavior is favored and in which the subject is his own experimental control, with the aim of identifying the similarities and/or differences between the parameters of selection and consumption behavior in each of the experimental sessions, as well as the variations between one session and another.
4. Include linguistic interactions within the study variables to evaluate their influence on food selection and consumption behavior.
REFERENCES
1. Armitage G, Hervey GR, Rolls BJ, Rowe EA, Tobin G. The effects of supplementation of the diet with highly palatable foods upon energy balance in the rat. J Physiol. 1983;342:229-51.
2. Asociación Psiquiátrica Americana. Manual Diagnóstico y Estadístico de los Trastornos Mentales DSM-IV-TR. Barcelona: Edit. Toray Masson; 2005.
3. Barber T, Viña JR, Viña J, Cabo J. Decreased urea synthesis in cafeteria-diet-induced obesity in the rat. Biochem J. 1985;230:675-81.
4. Becoña E, Vázquez F, Oblitas L. Promoción de los estilos de vida saludables. Investig En Detalle [Internet]. 2004;5. Disponible en: http://www.alapsa.org/detalle/05/index.htm
5. Blundel JE. Serotonin and appetite. Neuropharmacology. 1984;22:1537-51.
6. Bolles RC. A functionalistic approach to feeding. En: Capaldi ED, Powley TL, editores. Taste, Experience and Feeding: Development and learning. Washington, D.C.: American Psychological Association; 1993. p. 3-13.
7. Booth DA. Satiety and appetite are conditioned reactions. Psychosom Med. 1977;39:76-81.
8. Booth DA. Cognitive experimental psychology of appetite. En: Boakes RA, Popplewell DA, Burton MJ, editores. Eating habits: food, physiology and learned behavior. Gran Bretaña: John Wiley & Sons Ltd; 1987. p. 175-209.
9. Brobeck JR. Food and temperature. Recent Prog Horm Res. 1960;16:439-66.
10. Cabanac M. Physiological role of pleasure. Science. 1971;173:1103-7.
11. Cannon WB, Washburn AL. An explanation of hunger. Am J Physiol. 1912;29:441-54.
12. Capaldi ED. Hunger and conditioned flavor preferences. En: Capaldi ED, Powley TL, editores. Taste, Experience, & Feeding: Development and Learning. Washington, D.C.: American Psychological Association; 1993. p. 157-69.
13. Capaldi ED. Conditioned food preferences. En: Capaldi ED, editor. Why we eat, What we eat. Washington, D.C.: American Psychological Association; 1996. p. 53-80.
14. Carlson NR. Fundamentos de Psicología Fisiológica. España: Prentice Hall; 1996.
15. Fernández AF. Tratamiento cognitivo-conductual de los trastornos de la conducta alimentaria (TCA): Anorexia y bulimia nerviosas. En: Caballo VE, editor. Manual para el tratamiento cognitivo-conductual de los trastornos psicológicos. Vol. 2. México: Siglo XXI; 1998. p. 185-208.
16. Foote JA, Murphy SP, Wilkens LR, Basiotis PP, Carlson A. Dietary Variety Increases the Probability of Nutrient Adequacy among Adults. J Nutr. 2004;134:1779–85.
17. Guinard JX, Brun P. Sensory-specific satiety: comparison of taste and texture effects. Appetite. 1998;31:141-57.
18. Herman CP, Polivy J. What does abnormal eating tell us about normal eating? En: Meiselman HL, MacFie HJH, editores. Food choice acceptance and consumption. Gran Bretaña: Blackie Academic & Professional; 1996. p. 207-38.
19. Hetherington MM, Rolls BJ. Sensory-Specific Satiety: Theoretical Frameworks and Central Characteristics. En: Capaldi ED, editor. Why We Eat, What We Eat: The psychology of Eating. Washington, D.C.: American Psychological Association; 1996. p. 267-90.
20. Hetherington MM. Sensory-Specific Satiety and its importance in meal termination. Neurosci Biobehav Rev. 1996;20:113-7.
21. Hetherington MM, Foster R, Newman T, Anderson AS, Norton G. Understanding variety: tasting different foods delay satiation. Physiol Behav. 2006;87:263-71.
22. Hetherington MM, Pirie LM, Nabb S. Stimulus satiation: effects of repeated exposure to foods on pleasantness and intake. Appetite. 2002;38:19-28.
23. Hetherington MM, Rolls BJ, Burley VJ. The time course of sensory-specific satiety. Appetite. 1989;12:57-68.
24. Johnson J, Vickers Z. Effects of flavor and macronutrient composition of food servings on liking, hunger and subsequent intake. Appetite. 1993;21:25-39.
25. Junta de Andalucía. Consejería de Asuntos Sociales. II Plan Andaluz Sobre Drogas y Adicciones. España: Consejería para la Igualdad y Bienestar Social, y Dia Cash, SL; 2002-2007.
26. Kazdin AE. Modificación de la conducta y sus aplicaciones prácticas. México: Manual Moderno; 2000.
27. Kennedy GC. The role of depot fat in the hypothalamic control and hormones during growth. Ann N Y Acad Sci. 1953;157:1049-60.
28. Le Magnen J. Efficacy of olfatory, tactile and other food stimuli in the acquisition and manifestation of appetite in rats. Appetite. 1999;33:43-51.
29. López-Espinoza A. Análisis experimental de la conducta alimentaria. An Psicol. 2007;23(2):258-63.
30. Martínez AG, López-Espinoza A, Aguilera V, Galindo A, De la Torre-Ibarra C. Observación y experimentación en psicología: una revisión histórica. Diversitas. 2007;3(2):213-25.
31. Marván LL, Pérez LA, Palacios GB. Sistema Mexicano de Alimentos Equivalentes. México: Fomento de Nutrición y Salud, AC; 2004.
32. Mayer J. Regulation of energy intake and body weight. The glucostatic theory and the lipostatic hypothesis. Ann N Y Acad Sci. 1955;63:15-43.
33. McCrory MA, Fuss PJ, McCallum JE, Yao M, Vinken AG, Hays NP, Roberts SB. Dietary variety within food groups: association with energy intake and body fatness in men and women. Am J Clin Nutr. 1999;69:440-7.
34. Meiselman HL. The contextual basis for food acceptance, food choice and food intake: the food, the situation and the individual. En: Meiselman HL, MacFie HJH, editores. Food choice acceptance and consumption. Gran Bretaña: Blackie Academic & Professional; 1996. p. 239-63.
35. Pavlov IP. Conditioned reflexes. London: Oxford University Press; 1927.
36. Pinel JPJ. Biopsicología. España: Pearson; 2007.
37. Rolls BJ. Experimental analyses of the effects of variety in a meal on human feeding. Am J Clin Nutr. 1985;42:932-9.
38. Rolls BJ, van Duijvenvoorde PM, Rolls ET. Pleasantness changes and food intake in a varied four-course meal. Appetite. 1984;5:337-48.
39. Rozin P. Sociocultural influences on human food selection. En: Capaldi ED, editor. Why we eat, what we eat: The psychology of eating. Washington, D.C.: American Psychological Association; 1996. p. 233-63.
40. Unikel SC, Caballero RA. Guía Clínica para trastornos de la Conducta Alimentaria. México: Instituto Nacional de Psiquiatría Ramón de la Fuente; 2010.
41. Weingarten HP. Learning, homeostasis, and the control of feeding behavior. En: Capaldi ED, Powley TL, editores. Taste, Experience and Feeding: Development and learning. Washington, D.C.: American Psychological Association; 1993. p. 14-27.
42. Young PT. The experimental analysis of appetite. Psychol Bull. 1941;38(3):129-64.
43. Young PT. Hedonic organization and regulation of behavior. Psychol Rev. 1966;73(1):59-86.
FINANCING
None.
CONFLICT OF INTEREST
None.
CONTRIBUTION AUTHORSHIP
Conceptualization: Carolina De La Torre Ibarra.
Data curation: Carolina De La Torre Ibarra.
Formal analysis: Carolina De La Torre Ibarra.
Research: Carolina De La Torre Ibarra.
Methodology: Carolina De La Torre Ibarra.
Project administration: Carolina De La Torre Ibarra.
Resources: Carolina De La Torre Ibarra.
Software: Carolina De La Torre Ibarra.
Supervision: Carolina De La Torre Ibarra.
Validation: Carolina De La Torre Ibarra.
Visualization: Carolina De La Torre Ibarra.
Writing – original draft: Carolina De La Torre Ibarra.
Writing – review and editing: Carolina De La Torre Ibarra.