doi: 10.56294/mw2024485
ORIGINAL
Motivation in the human process as a determining factor in work performance
La motivación en el proceso humano como factor determinante en el desempeño laboral
Benjamín Villegas Alcántar1
![]() *
*
1Universidad de Guadalajara, Maestría en Administración de Negocios. Jalisco, México.
Cite as: Villegas Alcántar B. Motivation in the human process as a determining factor in work performance. Seminars in Medical Writing and Education. 2024; 3:485. https://doi.org/10.56294/mw2024485
Submitted: 01-10-2023 Revised: 21-02-2024 Accepted: 07-05-2024 Published: 08-05-2024
Editor: PhD.
Prof. Estela Morales Peralta ![]()
Corresponding Author: Benjamín Villegas Alcántar *
ABSTRACT
Introduction: the study analyzed the influence of motivational factors on work performance within small and medium-sized companies in Tepatitlán de Morelos, Jalisco. Based on previous theories, it was determined that motivation directly affects personnel performance. We sought to formulate a model applicable to similar companies, optimizing business results through motivational strategies.
Method: the research adopted a quantitative approach with a non-experimental, cross-sectional and correlational-causal design. A questionnaire based on validated measurement scales was applied and distributed to 94 employees of three companies. The dimensions of motivation (achievement, power and affiliation) and work performance (expectations, instrumentality and valence) were evaluated. Pearson’s correlation coefficient and the Chi-square test in SPSS were used for data analysis.
Results: the findings showed a positive mean-considerable correlation (r=0,637) between motivation and job performance. The achievement factor had the greatest influence on performance, followed by affiliation and power. It was identified that employees valued self-fulfillment and confidence in achieving goals the most, while they showed less interest in exercising authority. In addition, distrust in the performance-reward relationship was observed, which affected motivation.
Conclusions: it was confirmed that the satisfaction of motivational factors improves work performance. It was recommended that companies develop strategies focused on self-fulfillment and strengthening trust in incentives. The results serve as a basis for future research and business optimization models.
Keywords: Motivation; Work Performance; Motivational Factors; Business Strategies; Correlation.
RESUMEN
Introducción: el estudio analizó la influencia de los factores motivacionales en el desempeño laboral dentro de pequeñas y medianas empresas de Tepatitlán de Morelos, Jalisco. Basado en teorías previas, se determinó que la motivación afecta directamente el rendimiento del personal. Se buscó formular un modelo aplicable a empresas similares, optimizando los resultados empresariales mediante estrategias motivacionales.
Método: la investigación adoptó un enfoque cuantitativo con diseño no experimental, transversal y correlacional-causal. Se aplicó un cuestionario basado en escalas de medición validadas, distribuido a 94 empleados de tres empresas. Se evaluaron las dimensiones de motivación (logro, poder y afiliación) y desempeño laboral (expectativas, instrumentalidad y valencia). Para el análisis de datos se utilizaron el coeficiente de correlación de Pearson y la prueba de Chi cuadrada en SPSS.
Resultados: los hallazgos mostraron una correlación positiva media-considerable (r=0,637) entre motivación y desempeño laboral. El factor de logro obtuvo la mayor influencia en el desempeño, seguido de la afiliación y el poder. Se identificó que los empleados valoraban más la autorrealización y la confianza en alcanzar metas, mientras que mostraron menor interés por ejercer autoridad. Además, se observó desconfianza en la relación desempeño-recompensa, lo que afectaba la motivación.
Conclusiones: se confirmó que la satisfacción de factores motivacionales mejora el desempeño laboral. Se recomendó a las empresas desarrollar estrategias enfocadas en la autorrealización y en el fortalecimiento de la confianza en incentivos. Los resultados sirven como base para futuras investigaciones y modelos de optimización empresarial.
Palabras clave: Motivación; Desempeño Laboral; Factores Motivacionales; Estrategias Empresariales; Correlación.
INTRODUCTION
Improving work performance is a priority for any employer. As Flores (2011) analyzed, modifying motivation variables will always be related to the level of human factor performance. The research aims to formulate a model that can be applied to small and medium-sized enterprises in Tepatitlán de Morelos to achieve the planned results through increased employee performance.
According to studies by Saavedra (2012), small and medium-sized enterprises represent three-quarters of the country's workforce. This research focuses on small and medium-sized enterprises in Tepatitlán de Morelos, Jalisco, which are a strong engine for the region's economy and a strong source of employment in Tepatitlán. This is why it is essential to have relevant information to optimize companies' results.
The benefits that the research aims to present, as García (2012) states, are directly related to the financial side; they result from production goals and efficiency plans regarding labor and salary compensation. Business owners will have research that will help in decision-making and administrative planning, and the results obtained will serve as a basis for developing business models.
The strategies that are sought, in addition to being focused on the economic part, also consider the organization's perception. External actors, such as customers and suppliers, and internal actors, such as employees and managers, are involved. Analyzing the studies of Hernández, Quintana, Guedes, Mederos, and Sablón (2005), the perception of service quality indicates motivation in the organization. Similarly, Salazar, Guerrero, Machado, and Cañedo (2009) suggest that organizational climate is an influential factor in motivation; these two contributions can be summarized as clear benefits of motivation on how employees work.
The results represent the basis for the realization of plans and programs in organizational behavior, which implies synergy between employees, groups, and structure (Robbins, 2009). However, they will be focused on small and medium-sized companies in the Tepatitlán area. They can be applied to companies with similar personnel structures. It is difficult to generalize the results to any small or medium-sized company because characteristic aspects of thought, as well as customs of the employees of the highlands of Jalisco, will be taken into account. Similarly, if one wishes to consider the information obtained, one will have to analyze the social aspects of the employees.
In addition to the theoretical contributions made by the research, as part of the methodological process, an instrument was designed and validated to be used in future research or studies related to motivation and work performance. The design was based on analyzing previously developed valid instruments; pilot tests and strict reliability analyses were carried out to ensure methodological validity. This is another contribution that justifies the research.
Problems
The relationship between motivation and job performance has been researched in different case studies. Jaén (2010) predicted job performance based on the level of motivation shown by different employees. His conclusions show a clear positive trend in performance. Although this research considers psychological factors, it is a precedent for the situation that was analyzed with the instruments and data analysis.
The leading cause of the problem is the lack of certainty about the relationship between motivation and job performance. Although studies and research delve into the subject and offer theories to understand the correlation between motivational factors and job performance, in Tepatitlán, the certainty about this interaction is substantial. Assumptions and empirical decision-making have set the course for actions related to human capital.
Currently, motivation strategies and plans in small and medium-sized enterprises in Tepatitlán are carried out in a trial-and-error manner, either out of tradition or because it has worked for them. Due to the limited information available regarding studies focused on human resources in Tepatitlán, Martínez (2009) provides a solution to a similar problem in his research. In his study, he looked for a way to implement a motivation model for the performance of a small company. The present research aims to determine the necessary factors for creating and applying models that optimize work performance through motivation.
Some studies approach the problem from a group perspective; in this approach, two triggers are presented that influence the functioning of an organization, as presented in his research by Salazar (2009), the organizational climate and culture are indicators that measure a group's perception of its physical and social environment, to identify the external factors that correlate with employee performance, the context in which the problem develops must be analyzed, in this case, it focuses on the human resources of small and medium-sized companies in Tepatitlán de Morelos, Jalisco.
Generalizing the results seems to be the biggest problem, but it is seen as the most significant area of opportunity; various investigations, such as that of Carballé (2015), focus on motivation strategies to raise work performance; in the same way, Rodríguez (2015) in his article mentions motivation as a general trigger for work performance; Agut (2007) generalizes the factors that contribute to the level of motivation from a general approach. In his research, he pigeonholes every human being with the same thinking. The problem to be faced consists of identifying the motivational factors, specifically those of the employees of Tepatitlán, without considering a particular case but being transparent about the similarities they present.
How do the individual's motivational factors influence the achievement of positive work performance?
Objective
To determine the influence of the individual's motivational factors on the achievement of positive work performance
METHOD
Approach to the study
The research approach is quantitative, although due to the nature of the study's subject, it shares some characteristics with the qualitative approach. Motivation and motivational processes are not quantifiable in the first instance. Using the Likert scale of measurement, the variables involved were analyzed using numerical methods, which provided the basis for the study approach.
The present research was based on establishing suppositions as a result of evaluations carried out and determining the degree to which these suppositions were well-founded. These two principles belong to the quantitative and qualitative approaches, both of which employ methodical and empirical processes, so it is normal for research to share the characteristics of both approaches. However, the present work involves mainly quantitative processes and foundations.
One of the main characteristics confirming the quantitative approach to research is the need to measure the magnitudes of the investigated phenomena. In the present case, we refer to the motivational process, the formulation of statistical hypotheses and their approval or refutation by means of validated research designs, and the collection of data for subsequent statistical analysis as fundamental to determining the quantitative approach of the work.
The characteristics that ultimately define the quantitative approach to research are the attempt to generalize the results obtained from the samples analyzed, the aim that the results obtained can be applied to the study population, and the certainty that the studies can be replicated. The results are the same: to aim to be as objective as possible and, above all, to have a structured and statistically approved data collection and analysis process.
Scope of the research
The scope of the research is correlational; this type of research aims to understand the relationship or degree of association that exists between two or more variables (Sampieri, 2014); as an addiction to this characteristic, the study is often based on the relationship of only two variables, as was the case in the present research, when working on correlational studies it is important to delimit the context of the variables, in this way, the results obtained can be generalized and replicated.
To evaluate the magnitude of the association between two variables, the first step is to measure each variable; then, the resulting correlations must be quantified, analyzed, and assigned values. In the particular case of this research, the variables involved are:
· Motivational factors (achievement, power, and affiliation) established in McClelland's theory of needs.
· Job performance: determined by the interaction between Vroom's expectation theory variables.
Predicting the performance of the individual about the needs and expectations that are fulfilled is one of the results that the research aims to obtain. This end aligns with the primary utility of studies with a correlational scope, which is to know how a concept or variable behaves about other linked variables. In other words, it is used to predict the behavior of the dependent variables relative to the independent variables (Hernández, 2014).
Research design
The research design is non-experimental, with a cross-sectional classification and correlational-causal purpose. Research design is the strategy to obtain the information necessary to respond to the problem (Hernández, 2014). Research design can be classified into experimental research and non-experimental research. The former refers to carrying out an action and then observing the consequences, whereas in non-experimental designs, phenomena are recorded as they occur in their natural context without intentionally modifying variables.
Non-experimental designs can be classified according to their temporal dimension, according to the points in time at which the data were collected. The existing classifications are longitudinal and transversal. Within the longitudinal classification are all the investigations that collect information at different points in time, while transversal investigations collect information at a single moment (Hernández, 2014). Due to this characteristic, the present investigation is classified as transversal.
The transversal studies are divided into exploratory, descriptive, and correlational-causal. Exploratory studies aim to understand a variable or a set of variables in a specific situation or context. Descriptive studies aim to investigate the category of one or more variables. Studies classified as correlational-causal analyze and establish relationships between two or more variables, categories, or concepts. This research work fulfills the characteristics of a correlational-causal study.
Population and sample calculation
The aim of the sample is to be representative of the population. To achieve this, the first phase is calculating the sample, which consists of delimiting the study population. In this case, the population is the workers of small and medium-sized enterprises in Tepatitlán de Morelos, Jalisco. Information from (I. I. E. G. 2018) shows that in December 2017, the number of employees insured by the IMSS was 30,265 (Thirty thousand two hundred and sixty-five).
The formula used to calculate the sample is the one presented in (Fidias, 2012):
![]()
Nomenclature
· n = Sample size.
· N = Population size.
· Z = Confidence level, this value represents the probability that the researcher will have to generalize without making a mistake. For authors such as (Hernández, 2014), the confidence level for research should be between 95 and 99 %. Each researcher will apply the level they consider appropriate for their study. The value that is substituted is the one obtained through the calculation of a normal distribution.
· e = Sampling error, this value refers to the potential error that is admitted in the research, the most common are between 1 and 5 % (Fidias, 2012).
· p = Proportion of elements that present the characteristic to be investigated.
· q = Proportion of elements that do not present the characteristic to be investigated.
The values used are:
· N = 30265.
· Z = 1,96, represents a 95 % confidence level.
· e = 0,045, equivalent to a 4,5 % sampling error.
· p = 0,95.
· q = 0,05.
Substitution and mathematical procedures are developed as follows:
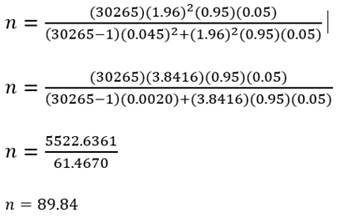
Sample size: 90. This indicates that if we take a sample of ninety employees, the research's confidence level is 95 %, and we will admit a sampling error of 4,5 %. For practical reasons, the sample taken for the present study was 94 individuals.
Data collection
Data collection is a process of defined and structured steps. First, the appropriate design for the research must be defined. In the present work, a non-experimental type of research was delimited, so the data was collected without intentionally modifying the environment. As it was a cross-sectional study, the data were obtained simultaneously. The objective of the data collection is to get information on the influence of motivational factors on work performance, a correlational-causal scope.
The information source was obtained through ninety-four employees distributed in three different companies located in the city of Tepatitlán de Morelos, Jalisco. The questionnaire was used as a method to collect the information. Through the application of an instrument validated by means of Cronbach's alpha factor, the information obtained was organized in a data matrix for its subsequent analysis.
Instrument design
The first step in designing the instrument is determining the measured variables. To do this, it is necessary to analyze the purpose of the research: "To determine the influence of the motivational factors of the individual on obtaining a positive job performance." As the objective corresponds to a study of correlational scope, it is broken down into dependent and independent variables. For the present investigation, the variables are:
· Independent variable: Motivational factors.
· Dependent variable: Job performance.
For the numerical verification of the hypothesis, its statistical interpretation is necessary. To do this, they are described in the form of equality. To test the research hypothesis "Hi," the correlation between the independent variable "x" and the dependent variable "y" must be different from zero. On the other hand, to test the null variable, there must be no correlation coefficient.
Statistical hypotheses
Hi: rxy ≠ 0
Ho: rxy = 0
McClelland's theory of needs was used to analyze motivational factors. This theory establishes that the factors that influence motivation are broken down into needs for Achievement, power, and Affiliation. Job performance will be measured by what is established in Victor Vroom's theory of expectations. The theory determines that job performance depends on the positive interaction of the variables: Expectancy, Instrumentality, and Valence.
Decomposition of variables into dimensions:
1. Motivational factors
· Achievement
· Power
· Affiliation
2. Work performance
· Expectancy
· Instrumentality
· Valence
For the instrument's design, we reviewed literature related to research on motivation and work performance, more precisely that which contained instruments for measuring motivational factors. One of the studies that formed the basis for the instrument's design was carried out by Álvarez (2012). His research aimed to validate a scale based on McClelland's motivational model. The results of his study were positive, and his instrument achieved a Cronbach's alpha of α = 0,88, which is why some of its items were adopted for the present study.
The research carried out by Sudarsky (1976) focused on designing an instrument to measure the motivational profile. He aimed to create an instrument to guide educational and immigration policies and human resources development. The variables included in his study are Achievement, power, Affiliation, and control; they used the Kuder-Richardson index (KR20) to validate the instrument, obtaining a result of KR20 = 0,82, which is considered reliable; the items analyzed were dichotomous, so some of them were adapted for the present investigation.
The items presented in the study by Steers and Braunstein (1976) were considered. In this study, an instrument was designed to measure the needs for Achievement, Affiliation, autonomy, and dominance using scales based on behavior. The final instrument presented acceptable levels of validity; this same instrument was translated and applied in the research of Palma (2000) with a Cronbach's alpha of α = 0,74, which is considered acceptable.
The instrument was developed using the items and structures of the studies mentioned above; a total of forty items were gathered in a design of the type: attitude scale with Likert scaling; this method was developed by Rensis Likert (1932). It is a current and reliable approach; Likert scaling is characterized by presenting a set of statements or postulates with reactions in three, five, or seven categories; for the design of the present instrument, it was decided to opt for the five-category modality.
The statements used in the instrument were affirmative in nature, numerical parameters were used, with a scale from 1 to 5, their translation into attitudes is as indicated in Hernández (2014):
· 1 = Strongly disagree
· 2 = Disagree
· 3 = Neither agree nor disagree
· 4 = Agree
· 5 = Strongly agree
A pilot test was carried out on ten individuals. In a relaxed environment, clear instructions were given. The small sample had the opportunity to ask questions about any postulates they did not understand, as well as to make comments about confusing instructions. The data obtained was taken into account and adjustments were made to the wording of the items. The final items selected for the instrument were:
|
Table 1. List of items |
|
|
No. |
Item |
|
1.- |
I strive for excellence in everything I do |
|
2.- |
I confront people with whom I disagree |
|
3.- |
When I have to do something alone, I look for company |
|
4.- |
I enjoy the satisfaction of completing a difficult task |
|
5.- |
When I give my opinion, I expect it to be taken seriously |
|
6.- |
I have a good relationship with my colleagues |
|
7.- |
I am capable of completing the tasks assigned to me |
|
8.- |
In my job, they deliver on the promised rewards |
|
9.- |
Success in my job is important to me |
|
10.- |
I strive to have control over the events around me |
|
11.- |
Maintaining a good relationship with my colleagues is very important to me |
|
12.- |
I try to improve my work performance |
|
13.- |
I prefer to be the one giving orders. |
|
14.- |
I like working with others for a common cause |
|
15.- |
I trust in my ability to fulfill my responsibilities |
|
16.- |
If my boss promises a reward for good performance, I trust that he will deliver |
|
17.- |
Obstacles have the power to excite me |
|
18.- |
I like to influence people to achieve my goal |
|
19.- |
I like to belong to a group |
|
20.- |
I fight for things until I'm exhausted |
|
21.- |
I like to give my opinion and guide others with my point of view |
|
22.- |
I like to work in a team |
|
23.- |
When I give my all, I achieve the goals assigned to my job |
|
24.- |
I trust that prizes and rewards will be given out fairly |
|
25.- |
I like to compete |
|
26.- |
I would like to have authority over others |
|
27.- |
I am motivated by the friendship that exists in my work group |
|
28.- |
I am enthusiastic about working every day in line with the goals I have set myself |
|
29.- |
I tend towards situations that allow me to exert influence |
|
30.- |
I feel comfortable working with more people |
|
31.- |
The objectives set by my bosses are realistic and achievable |
|
32.- |
When I achieve the objectives assigned to me, I am given the promised reward |
|
33.- |
I set myself new goals once I have finished a job |
|
34.- |
I am interested in being the boss of my work area |
|
35.- |
I offer help without expecting anything in return |
|
36.- |
I like working in difficult and challenging situations |
|
37.- |
I plan my work |
|
38.- |
My co-workers are important to me |
|
39.- |
I believe that the goals and objectives in my work are achievable |
|
40.- |
When I perform well, I trust that I will be rewarded |
Operationalization of variables
|
Table 2. Operationalization of variables |
|||||||||||
|
Variable |
Dimension |
Item number |
|||||||||
|
Motivational factors |
Achievement |
1 |
4 |
9 |
12 |
17 |
20 |
25 |
28 |
33 |
36 |
|
Power |
2 |
5 |
10 |
13 |
18 |
21 |
26 |
29 |
34 |
37 |
|
|
Affiliation |
3 |
6 |
11 |
14 |
19 |
22 |
27 |
30 |
35 |
38 |
|
|
Job performance |
Expectations |
7 |
15 |
23 |
31 |
39 |
|
|
|
|
|
|
Instrumentality |
8 |
16 |
24 |
32 |
40 |
|
|
|
|
|
|
The “Valence” dimension corresponding to the work performance variable is not found in the operationalization table because it will be measured by means of the motivational factors. Valence corresponds to the importance that the individual attaches to a potential incentive. In this case, the potential incentives are represented by the satisfaction of McClelland's needs.
Instrument reliability
There are different coefficients used to calculate the reliability of an instrument, the most used and statistically accepted are Cronbach's Alpha developed by J.L. Cronbach and KR20 developed by Kuder and Richardson, KR20 is used to analyze instruments with dichotomous items and Cronbach's Alpha is used to analyze items with Likert scale.
To calculate the reliability of the instrument, Cronbach's alpha coefficient was used, through the statistical program IBM SPSS Statistics version 22.0, and the results were as follows:
|
Table 3. Reliability statistics |
|
|
Cronbach's alpha |
No. of items |
|
0,825 |
40 |
A positive result was obtained, a coefficient of α = 0,825 which determines a “good” reliability for the instrument, although there is no exact rule on an acceptable coefficient, in Hernández (2014) this result is interpreted as a high reliability, other authors in research methodology share this same interpretation.
RESULTS
Statistical data analysis
The data analysis was done using the statistical program SPSS version 22.0, software developed at the University of Chicago. As a statistical package specializing in social science research, SPSS (Statistical Product and Service Solutions) contains the statistical analyses necessary for research, such as Pearson's correlation coefficient, Chi-square X2, and Cronbach's alpha coefficient. For the creation of graphs, the program Tableau in version 10.5 was used.
Descriptive analysis
The results were divided by items, dimensions, and variables for the descriptive analysis of the information. In each aspect, a discussion was carried out between the results obtained and what was established in the theory. In the same way, the most relevant results of each level are presented, the numerical values obtained per item are shown graphically, and how these, in the first instance, make up the dimensions and, finally, the variables.
Descriptive analysis by item
Analyzing graphically (figure 1) the results of the items that make up the achievement dimension, a result below the average was observed in "I like to compete" and in "Obstacles have the power to excite me"; this indicates low rates in competitive personalities, on the other hand, the statements "I enjoy the satisfaction of finishing a difficult task" and "I try to improve my work performance" were the items with the highest scores, which is interpreted as a greater need for feelings of satisfaction and self-commitment, the average of the achievement dimension was 4,38 which can be interpreted as an attitude of agreement with the achievement dimension.
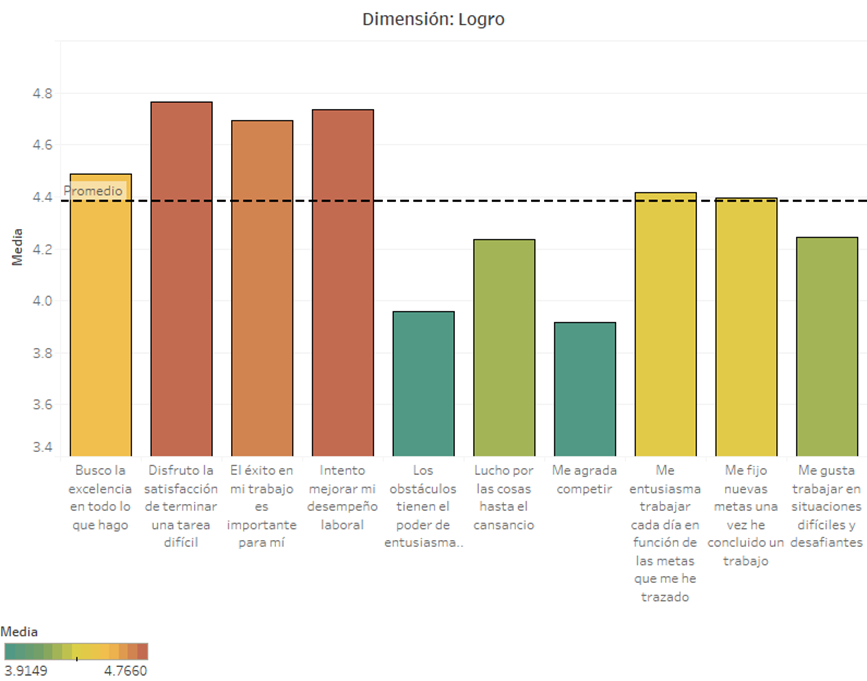
Figure 1. Graphical results of the frequency of achievement
|
Table 4. Numerical results by item of the achievement dimension |
|||||
|
Dimension: Achievement |
|||||
|
Item |
N |
Minimum |
Maximum |
Average |
Standard deviation |
|
I strive for excellence in everything I do |
94 |
3 |
5 |
4,49 |
0,668 |
|
I enjoy the satisfaction of completing a difficult task |
94 |
1 |
5 |
4,77 |
0,612 |
|
Success in my work is important to me |
94 |
3 |
5 |
4,69 |
0,549 |
|
I try to improve my work performance |
94 |
3 |
5 |
4,73 |
0,532 |
|
Obstacles have the power to excite me |
94 |
2 |
5 |
3,96 |
0,854 |
|
I fight for things until I drop |
94 |
2 |
5 |
4,23 |
0,754 |
|
I like to compete |
94 |
2 |
5 |
3,91 |
0,935 |
|
I am enthusiastic about working every day towards the goals I have set for myself |
94 |
3 |
5 |
4,41 |
0,629 |
|
I set myself new goals once I have finished a job |
94 |
2 |
5 |
4,39 |
0,895 |
|
I like to work in difficult and challenging situations |
94 |
1 |
5 |
4,24 |
0,799 |
In the descriptive results on the power dimension, three items were observed (figure 2) with a notable rating below the average. "I confront people with whom I disagree" is interpreted as a low level of interest in workers regarding situations that represent a discussion or debate with colleagues. The low results in the items: "I would like to have authority over others "and 'I prefer to be the one who gives the orders,’' refer to employees' lack of interest in exercising authority over their colleagues.
" When I give my opinion, I expect it to be taken seriously" was the item with the highest rating; it is interpreted as the high interest that employees have in being taken seriously in general, and the power dimension obtained an average of 3,8, this average was the lowest of the three dimensions that make up the motivational factors. When analyzing the items in general, a predilection for situations that give power to the workers' opinions can be observed. However, the activities with the least interest are those in which responsibilities or authority interfere.
|
Table 5. Numerical results by item of the power dimension |
|||||
|
Dimension: Power |
|||||
|
Item |
N |
Minimum |
Maximum |
Average |
Standard deviation |
|
I confront people with whom I disagree. |
94 |
1 |
5 |
3,29 |
1,033 |
|
When I give my opinion, I expect it to be taken seriously |
94 |
1 |
5 |
4,48 |
0,758 |
|
I strive to have control over the facts around me |
94 |
2 |
5 |
4,21 |
0,828 |
|
I prefer to be the one giving orders. |
94 |
1 |
5 |
3,35 |
0,991 |
|
I like to influence people to achieve my goal |
94 |
1 |
5 |
3,79 |
1,116 |
|
I like to give my opinion and guide with my point of view |
94 |
2 |
5 |
4,15 |
0,775 |
|
I would like to have authority over others |
94 |
1 |
5 |
3,18 |
1,191 |
|
I am drawn to situations that allow me to gain influence |
94 |
1 |
5 |
3,71 |
0,957 |
|
I am interested in being the boss of my work area |
94 |
1 |
5 |
3,66 |
1,441 |
|
I plan my work |
94 |
1 |
5 |
4,20 |
0,899 |
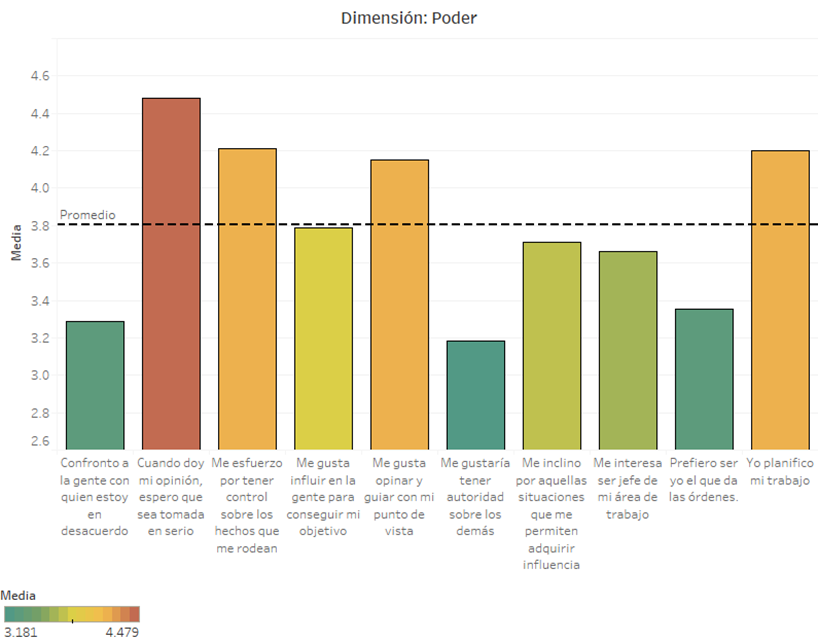
Figure 2. Graphical results of the power frequency
Similar results characterized the affiliation dimension (figura 3); the item that is very notable for its disparity is "When I have to do something alone, I look for the company.” The low result is interpreted as a lack of interest on the part of workers in seeking company in tasks that must be carried out individually; the search for a company is a characteristic of the affiliation dimension; the statement refers to the search for the company during individual work, in the same way, employees showed low interest in situations in which the work is collaborative.
There are two ways of interpreting power in the theory of needs. The first refers to the attraction to situations that represent authority over others, and the second relates to situations that give control over one's decisions. The items with the highest degree of impact were "I need to maintain a good relationship with my colleagues" and "I offer help without expecting anything in return." in both cases, a high degree of interest in empathy and selfless collaboration in the workgroup is interpreted, the average of the affiliation dimension was 4,03, affiliation is situated at a midpoint between power and achievement.
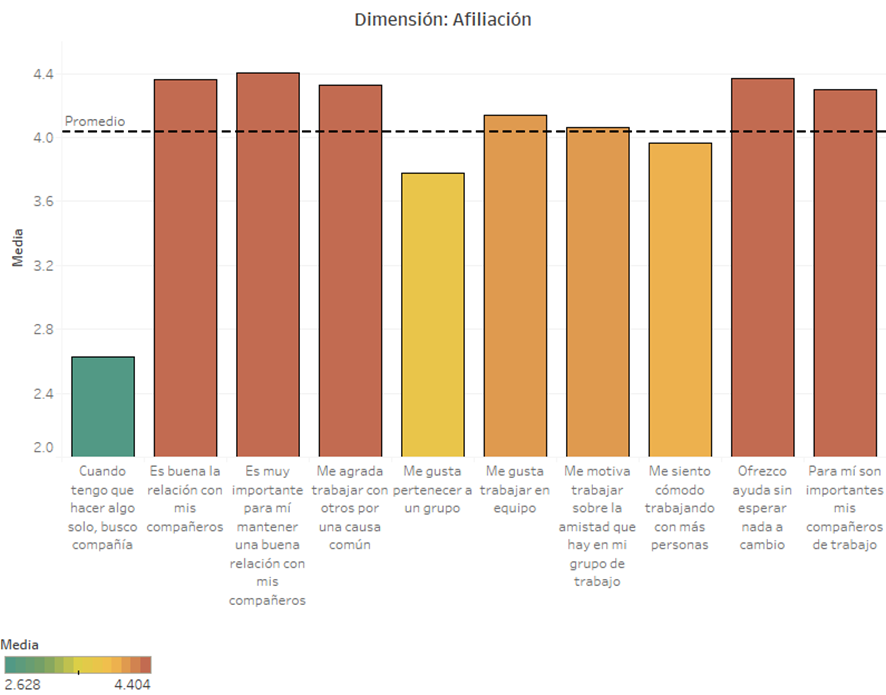
Figure 3. Graphical results of membership frequency
|
Table 6. Numerical results by item of the affiliation dimension |
|||||
|
Dimension: Affiliation |
|||||
|
Item |
N |
Minimum |
Maximum |
Average |
Standard deviation |
|
When I have to do something alone, I look for company |
94 |
1 |
5 |
2,63 |
1,236 |
|
I have a good relationship with my colleagues |
94 |
1 |
5 |
4,36 |
0,774 |
|
It is very important for me to maintain a good relationship with my colleagues |
94 |
2 |
5 |
4,40 |
0,766 |
|
I like working with others for a common cause |
94 |
2 |
5 |
4,33 |
0,808 |
|
I like belonging to a group |
94 |
1 |
5 |
3,78 |
1,049 |
|
I like working in a team |
94 |
2 |
5 |
4,14 |
0,837 |
|
I am motivated by the friendship in my work group |
94 |
1 |
5 |
4,06 |
0,971 |
|
I feel comfortable working with more people |
94 |
2 |
5 |
3,97 |
0,897 |
|
I offer help without expecting anything in return |
94 |
2 |
5 |
4,37 |
0,880 |
|
My coworkers are important to me |
94 |
2 |
5 |
4,30 |
0,760 |
Expectations (figure 4) is the first dimension involved in the variable of work performance. For its study, five items were implemented, and in the descriptive results, an overall average of 4,41 being the one with the highest approval rating, the item with the lowest rating was “The objectives imposed by my bosses are realistic and achievable”, this result is interpreted as a poor perception of the goals set by the company, this factor is important because it can lead to low employee motivation.
|
Table 7. Numerical results by item of the expectations dimension |
|||||
|
Dimension: Expectations |
|||||
|
Item |
N |
Minimum |
Maximum |
Average |
Standard deviation |
|
I am capable of completing the tasks assigned to me. |
94 |
3 |
5 |
4,55 |
0,561 |
|
I trust in my ability to fulfill my responsibilities. |
94 |
3 |
5 |
4,60 |
0,592 |
|
When I give my best, I achieve the goals assigned to me in my work. |
94 |
3 |
5 |
4,66 |
0,559 |
|
The objectives set by my bosses are realistic and achievable. |
94 |
1 |
5 |
3,89 |
0,967 |
|
I believe that the goals and objectives in my work are achievable. |
94 |
1 |
5 |
4,38 |
0,856 |
When the staff feel that the goals are impossible to achieve, a discouraging feeling is created. On the other hand, the highest degree of acceptance was obtained by the item “When I give my best effort, I achieve the goals assigned to me at work”, which refers to the high degree of confidence and ability that employees have. This factor is decisive in the performance of the staff.
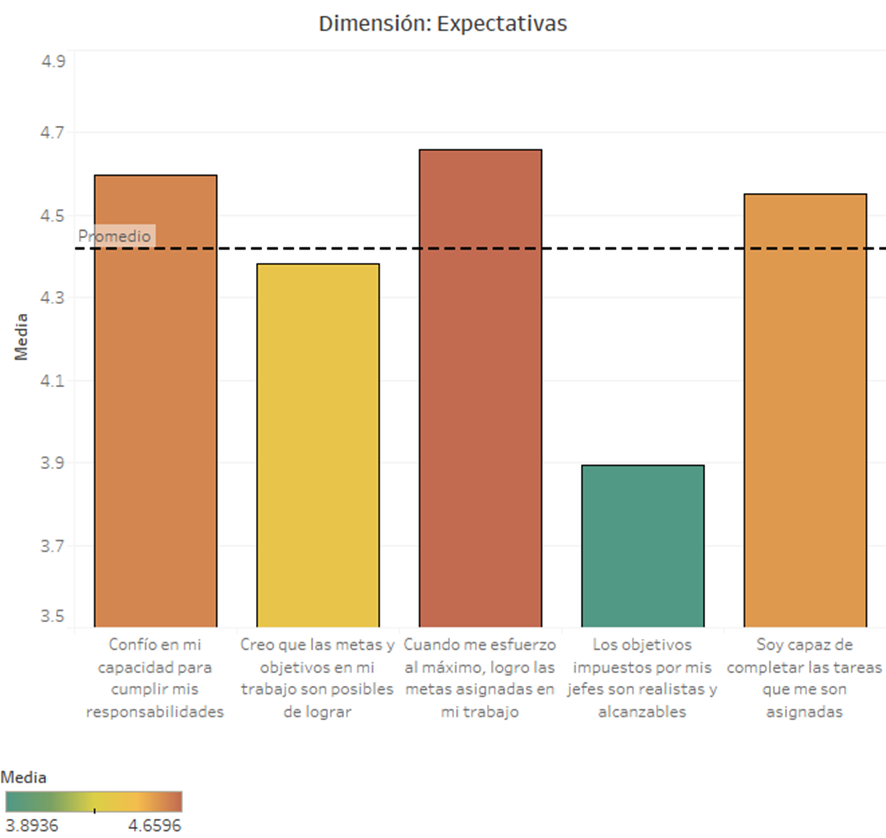
Figure 4. Graphical results of the frequency of expectation
Taking into account the dimensions of work performance, the instrumentality factor (figure 5) was the one that obtained the lowest degree of approval on average. Analyzing its items individually, the statement with the lowest and below-average result was “When I achieve the assigned objectives, I am given the promised reward.” This low result translates as operational problems in the distribution of rewards. Likely, the terms and conditions are not set correctly; the item with the highest rating was “If my boss promises a reward for good performance, I trust that he will deliver.” acceptance of this attitude represents a high degree of trust in workers in their bosses, this condition can become a strength in the implementation of strategies, the trust of workers in their managers is fundamental in the search for better performance.
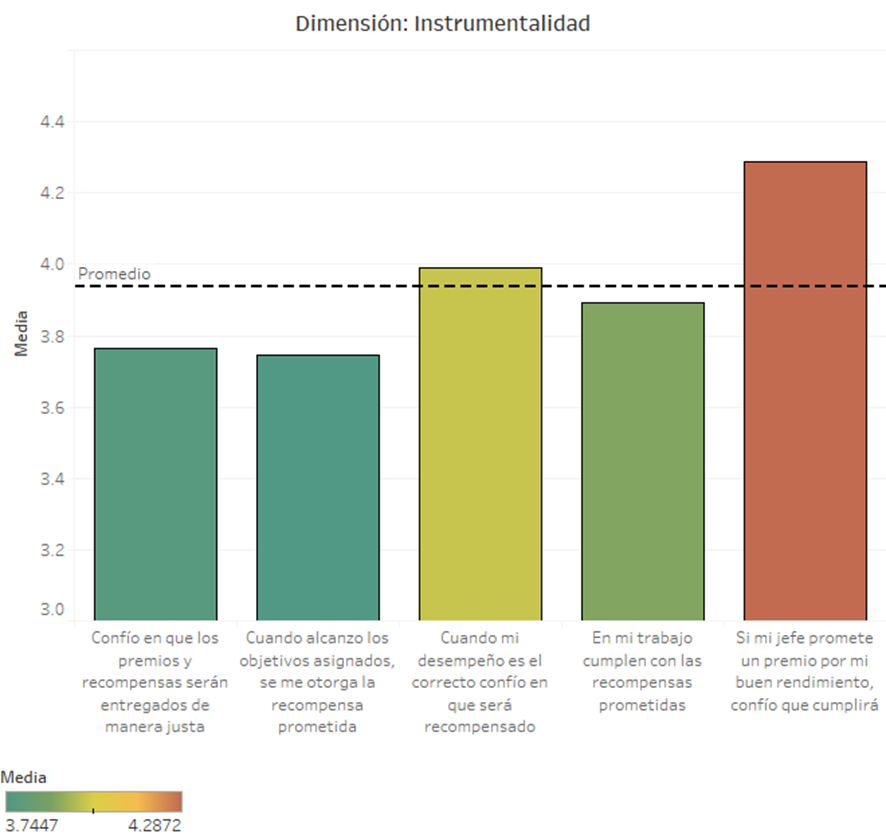
Figure 5. Graphical results of the frequency of instrumentality
|
Table 8. Numerical results by item of the instrumentality dimension |
|||||
|
Dimension: Instrumentality |
|||||
|
Item |
N |
Minimum |
Maximum |
Average |
Standard deviation |
|
In my job, the promised rewards are fulfilled |
94 |
1 |
5 |
3,89 |
1,062 |
|
If my boss promises a reward for good performance, I trust that it will be fulfilled |
94 |
1 |
5 |
4,29 |
0,969 |
|
I trust that the prizes and rewards will be given out fairly |
94 |
1 |
5 |
3,77 |
1,204 |
|
When I achieve the assigned objectives, I am given the promised reward |
94 |
1 |
5 |
3,74 |
1,154 |
|
When my performance is good, I trust that I will be rewarded |
94 |
1 |
5 |
3,99 |
1,159 |
Descriptive analysis by dimensions
Descriptively, a slight predominance was observed in the achievement factor, this being the one with the most significant weight with an average of 4,38, the Affiliation factor showed a value of 4,03, the factor with a lower result was power with an average of 3,8, standard deviations less than 0,5, which indicates that dispersion is moderate in general. The graph (figure 6) shows the behavior of the motivational factors and the notable dominance of the achievement dimension. When contrasting these results with those obtained in Contreras (2016), we find a disparity in the predominance of needs. This difference confirms that the motivational factors are modified according to demographic and social factors.
|
Table 9. Centralization and dispersion of the dimensions of motivational factors |
|||||
|
Variable: Motivational factors |
|||||
|
Item |
N |
Minimum |
Maximum |
Average |
Standard deviation |
|
Achievement |
94 |
3,4 |
5,0 |
4,3840 |
0,38530 |
|
Power |
94 |
2,4 |
4,9 |
3,8021 |
0,50884 |
|
Affiliation |
94 |
2,4 |
4,8 |
4,0340 |
0,47008 |
In the analysis of motivational factors by company (figure 6) a predominance of the achievement factor was observed, followed by the affiliation factor, company C shows the most balanced parameters, A and B with a greater difference in the results.
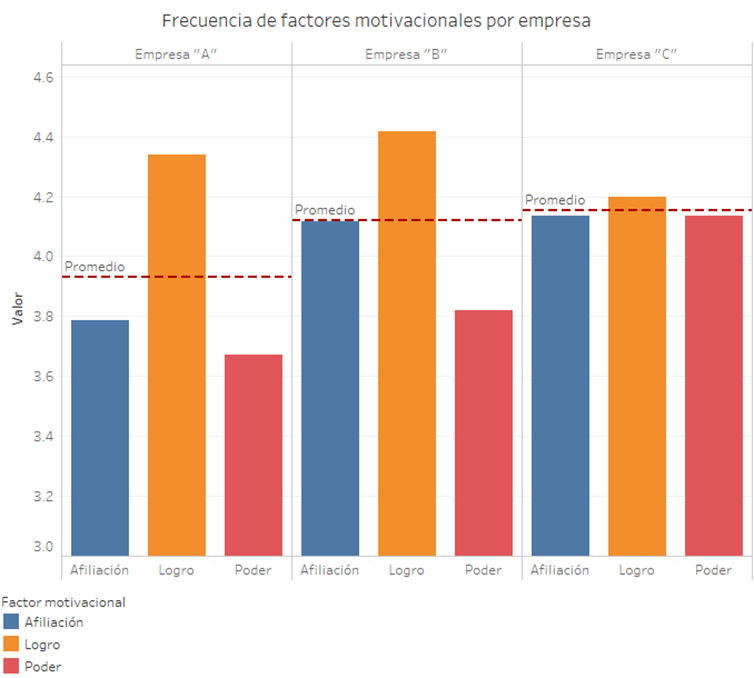
Figure 6. Frequency of motivational factors by company
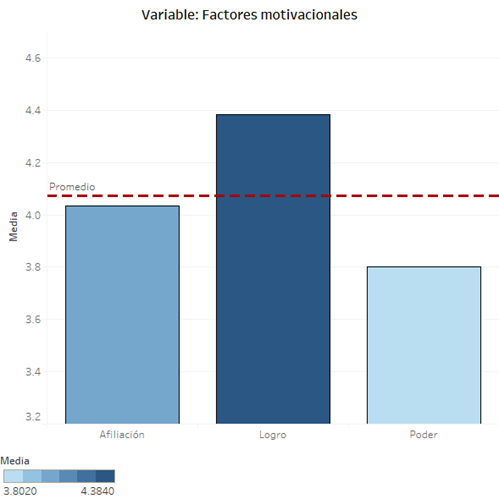
Figure 7. Graphical results of the variable: Motivational factors
Analyzing the variables that makeup job performance, a value of 4,41 was obtained descriptively in the expectations dimension, this being the highest rating, the value observed (figure 7) for the valence variable was 4,07, instrumentality obtained a value of 3,93 this being the factor with the lowest average, the deviations from the dimensions of expectations and valence were moderate, instrumentality shows a deviation of 0,89 which means a more excellent dispersion in measurements, the graph shows the high impact of the expectations process on the work performance variable.
|
Table 10. Centralization and dispersion of job performance dimensions |
|||||
|
Variable: Work performance |
|||||
|
Dimension |
N |
Minimum |
Maximum |
Average |
Standard deviation |
|
Expectations |
94 |
3,2 |
5,0 |
4,4170 |
0,38090 |
|
Instrumentality |
94 |
1,0 |
5,0 |
3,9362 |
0,89549 |
|
Valence |
94 |
3,1 |
4,9 |
4,0734 |
0,31941 |
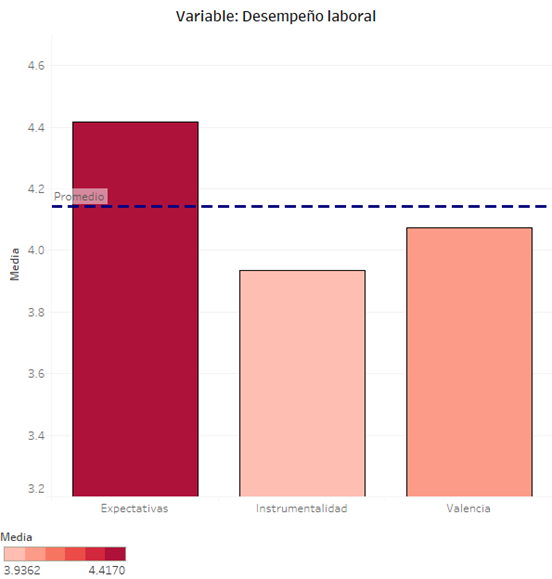
Figure 8. Graphical results of the variable: Job performance
Descriptive analysis by variables
Analyzing the data descriptively, similar values are obtained between both variables, with deviations of less than 0,5 in both cases. This is interpreted as a moderate dispersion for both parameters. It is important to point out that the important results were obtained from the correlation analysis; the present table only provides descriptive information.
|
Table 11. Measures of centralization and dispersion of the variables |
|||||
|
Variable |
N |
Minimum |
Maximum |
Average |
Standard deviation |
|
Motivational factors |
94 |
3,1 |
4,9 |
4,073 |
0,31941 |
|
Job performance |
94 |
2,8 |
5,0 |
4,142 |
0,42119 |
Chi-square statistical test X2
Chi-square is a statistical test that refers to the parameter of the relationship between two variables. It is symbolized with X2, and the hypotheses it seeks to prove are correlational (Hernández, 2014); for this reason, it was used in the present investigation, and its form of presentation is through a cross table. Therefore, the results were presented in the form of a contingency table; it is essential to note that the order in which the variables are arranged does not matter; in any case, the result of the test is the same, and the analysis was carried out in discussion with the theory and previous research.
The result of the Chi-square test is a coefficient of comparison between the results of the expected frequencies table and that of absolute frequencies. It is essential to understand that a statistical test starts from the assumption of the null hypothesis, that is, the one that establishes that there is no relationship between the variables. For this reason, its reading starts from 0 to 1; when the test result is less than 0,5, the null hypothesis is accepted, that is to say, there is a relationship between the variables. 05 the null hypothesis is rejected, that is to say, the hypothesis of no correlation; this is based on the expected level of confidence; the Chi-square test establishes the degree of incidence between both variables; for this reason, it must be complemented by Pearson's correlation test so that the research contains more excellent reliability in the results, the tables shown were made with the exact data shown in SPSS, similarly, in the annexes, there is a compilation of tables created in the statistical program
Chi-square analysis X2 per item
Six hundred Chi-square tests were carried out in relation to the forty items. Of the total results, four hundred sixty-four crosses obtained a result greater than 0,05, and one hundred thirty-six resulted in a Chi-square index of less than 0,05. The four cases with the lowest coefficient are presented, that is, the crosses of items that presented a higher degree of incidence in their responses.
The analysis of the intersection "The objectives imposed by my bosses are realistic and achievable" * "I fight for things until I'm exhausted" has almost a perfect incidence, which indicates that people who make every effort to achieve the company's objectives have a very similar perception of the goals that are imposed in the organization. The relationship between these items results from employees' confidence in their capacity and potential to achieve the assigned objectives.
|
Table 12. Chi-square test |
|
|
|
The objectives set by my bosses are realistic and achievable |
|
I fight for things until I'm exhausted |
0,00002 |
|
Number of valid cases 94 |
|
The work environment is related to the fulfillment of promised rewards, the relationship between these two factors was obtained from the crossing of the items “In my work the promised rewards are fulfilled” * “The relationship with my colleagues is good”. With a considerably low result in the Chi-square index, we can say that there is a high degree of incidence. The relationship between these two variables is the result of the atmosphere of trust generated by the fulfillment of the incentives and rewards proposed by the organization.
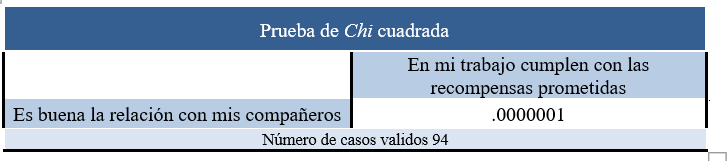
Figure 9. Chi-square test
The analysis of the intersection “I confront people with whom I disagree” * “I have a good relationship with my colleagues” involves factors related to personality. This result agrees with the results of Domínguez's research (2001), which establishes that factors that influence personality, such as tolerance and empathy, are decisive in the work environment.
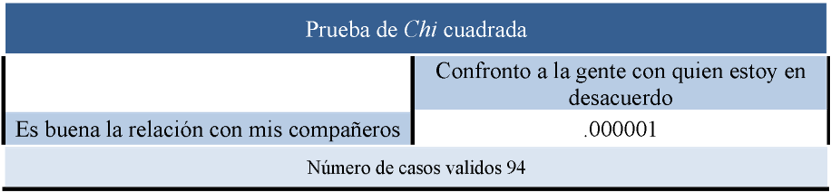
Figure 10. Chi-square test
Enrique Ogliastri (2008) carried out a study on the factor of affiliation and leadership, his results established that individuals with a high degree of affiliation possess a leadership focused on social activities, the crossing of the items “I like to influence people to achieve my goal” * “I like to belong to a group” agrees with Ogliastri's results, individuals with an interest in a sense of belonging have empathy with leadership roles.
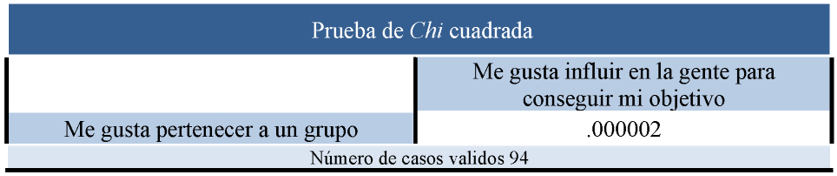
Figure 11. Chi-square test
Analysis of Chi-square X2 by dimension
All the possible combinations allowed by the six dimensions were analyzed, a total of fifteen different combinations; eight combinations of dimensions obtained a Chi-square coefficient of less than 0,05, seven combinations resulted in a coefficient greater than 0,05, the most significant ones were analyzed, the crossings of the valence dimension with the motivational factors were excluded, since valence is made up of the average of the power, affiliation, and achievement dimensions.
The crossing of the Achievement * Expectations dimension was the most significant, with a coefficient practically equal to zero. The degree of relationship between both factors is almost perfect, and the achievement dimension refers to the importance and impact that the satisfaction of reaching goals or objectives has for the individual; expectations represent the perception that employees have about the fulfillment of rewards and incentives by the company, the relationship between these dimensions is interpreted as a high degree of trust by the organization on the part of employees with self-realization needs.
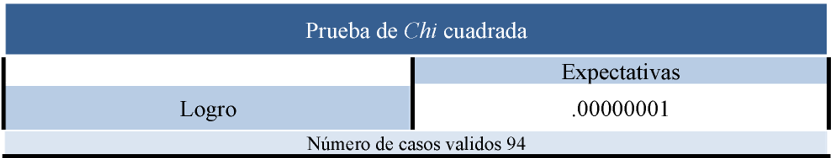
Figure 12. Chi-square test
When visualizing the high degree of incidence of the intersection of power * affiliation, the characteristics in common are analyzed, such as leadership and personality, contrasting this relationship with the results of the research of Cortés (2005) concordance was found in the study of Cortés it is established that social leaders tend to present a considerable degree of affiliation, more specifically of belonging, this is supported by the characteristics that a leader should possess, Robbins (2009) establishes that empathy for others is fundamental in the consolidation of a leader.
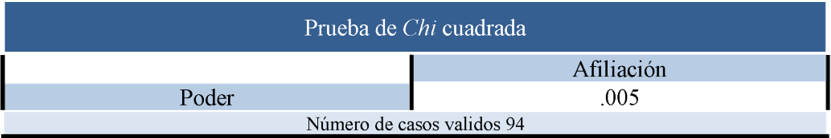
Figure 13. Chi-square test
Instrumentality refers to the confidence that employees have in themselves and in their own abilities. When an individual shows a high level of this parameter, it is said that they are confident that their performance will be what is needed to achieve the established goals. The analysis of the intersection between the dimensions of affiliation and instrumentality shows a relationship between workers who are confident in their abilities and those who are interested in belonging to a group.
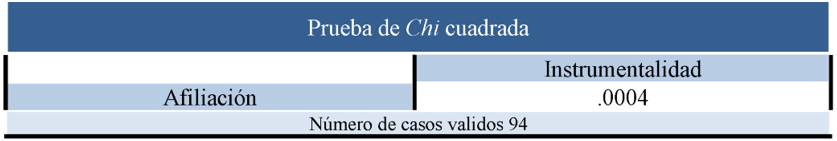
Figure 14. Chi-square test
The valence dimension is made up of the interest that employees place in the promised rewards. It is closely related to expectations and instrumentality. The interaction of these three dimensions can be used to establish job performance. The Chi-square coefficient for the intersection of the Valence * Expectations dimensions was 0,001, that is to say, there is almost an identical incidence between both dimensions, which shows that the perception they have in the fulfillment of the incentives is very similar to the importance they give to these same.
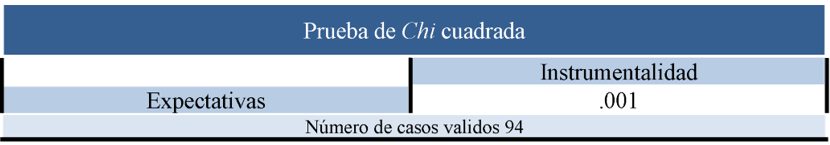
Figure 15. Chi-square test
Analysis of Chi-square X2 per variable
Based on Vroom's Expectancy Theory (1964), work performance depends on three factors: expectancy, instrumentality, and valence; McClelland's Theory of Needs (1953) establishes that motivation depends on the factors of achievement, power, and affiliation; the relationship between these two theories determines the degree of motivation and performance. Its analysis using the Chi-square relationship parameter determined that there is an incidence between both variables, with a result of 0,002, the hypothesis of no relationship is rejected, obtaining a high degree of confidence; supporting this result, a correlation test was carried out to confirm the relationship and direction of the relationship.
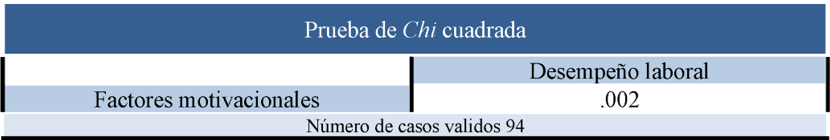
Figure 16. Chi-square test
Pearson's correlation coefficients
Pearson's correlation coefficient is a parametric test that analyzes the relationship between two variables, it is symbolized by the lowercase letter r and the hypotheses that it approves or rejects are correlational, the correlation is calculated from the values obtained from two variables, for the data analysis, correlation tests were carried out by items, by dimensions and by variables, as in the Chi-square analysis, the results are shown in a data matrix, regardless of the vertical or horizontal arrangement, the coefficient result can vary from -1,00 to 1,00, the interpretation established in the text by Hernández (2014) is as follows:
- 1,00 = Perfect negative correlation.
- 0,90 = Very strong negative correlation.
- 0,75 = Considerable negative correlation.
- 0,50 = Average negative correlation.
- 0,25 = Weak negative correlation.
- 0,10 = Very weak negative correlation.
0,00 = There is no correlation whatsoever between the variables.
+0,10 = Very weak positive correlation.
+0,25 = Weak positive correlation.
+0,50 = Medium positive correlation.
+0,75 = Considerable positive correlation.
+0,90 = Very strong positive correlation.
+1,00 = Perfect positive correlation.
In addition to the direct value of the correlation, the level of significance must be considered. This represents the level of confidence of the correlation. For the correlation to be considered true, the significance value must be less than 0,05. A value of this magnitude would represent a confidence level of 95 % and a probability of error of 5 %.
Pearson correlation coefficients per item
All possible analyses of correlation between items were carried out; seven hundred and eighty crosses in total; fourteen crosses obtained a correlation coefficient greater than 0,5; that is, they presented a correlation more significant than the average. The correlations of items of the same dimension were excluded for their analysis and interpretation. Two negative correlations of a considerable level were obtained. The study was carried out in discussion with the theory and previous research.
The way rewards are granted in the organization directly influences individuals' sense of trust. The result of the cross between "I trust that the prizes and rewards will be granted fairly" * "When I achieve the assigned objectives, I am awarded the promised reward" showed a positive correlation of above-average magnitude, indicating that the greater the fair fulfillment of rewards and incentives, the greater the trust in the staff. Sum's research (2015) established that companies that promote trust in the workers obtain higher performance rates. This indicator can be a source for the creation of motivation strategies.
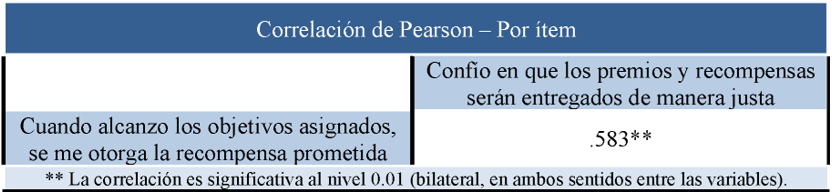
Figure 17. Pearson's Correlation - By item
Of all the item crossings using Pearson's correlation, the most significant result was for “When I achieve the assigned objectives, I am given the promised reward” * “When my performance is good, I trust that I will be rewarded” with a medium correlation of intensity, the positive relationship has its theoretical basis, Vroom's (1964) expectancy theory predicts a positive result in performance when it is rewarded in the promised way. This correlation also shows a congruence in companies between motivation plans and the incentives granted.
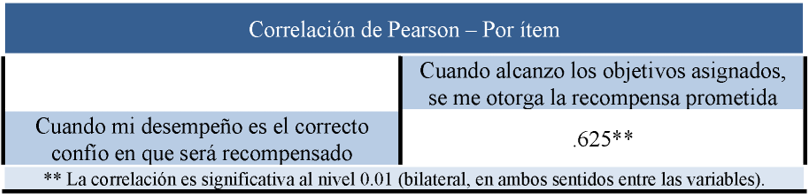
Figure 18. Pearson's Correlation - By item
McGregor's X and Y theory states that there are two types of personality: workers with an X personality avoid responsibilities and challenging situations, while those with a Y personality are motivated and enthusiastic about tasks that involve responsibility or obstacles (Robbins, 2005). This theory is used as a reference point for the analysis of the correlation “Obstacles have the power to excite me”. * “I like to work in difficult and challenging situations”, it is established that there is a considerable predominance of type Y personalities, and obstacles and challenging situations can be used as motivational factors.
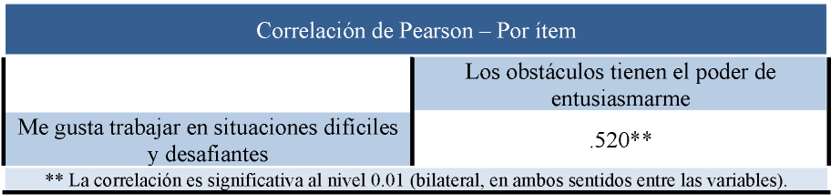
Figure 19. Pearson's Correlation - By item
Leadership plays a decisive role in the study of performance. In service-related issues, the study by Hernández (2011) establishes a strong correlation between leadership in hospital employees and the quality of the service they provide. The correlation of the items “I like to influence people to achieve my goal” * “I favor those situations that allow me to gain influence.” Based on previous research, we can establish that employees have the right skills to develop in service-related roles.
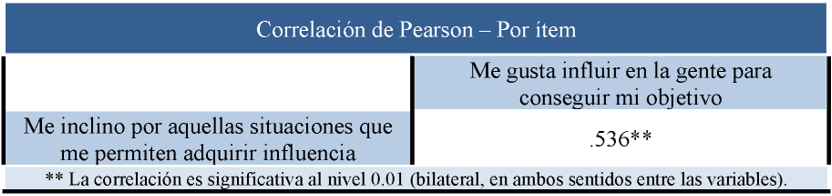
Figure 20. Pearson's Correlation - By item
Of the total number of Pearson correlations analyzed, two results were obtained with a negative value and with a weak-medium level. Although the level is not considerable, what is important in these cases is that they present negative directional relationships. The first belongs to the crossing of the items “I prefer to be the one who gives the orders” * “If my boss promises a reward for my good performance, I trust that he will deliver”. The first item in question belongs to the dimension of instrumentality, the second is part of the dimension of power, this means that the more confidence the employee has in his or her boss, the less preference he or she will have for taking on a leadership role. This approach contrasts with what is established in Ivancevich (2015), as trust is presented as a characteristic that leaders possess.
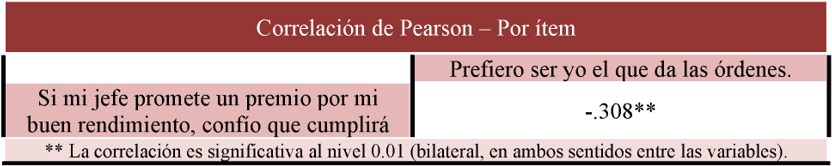
Figure 21. Pearson's Correlation - By item
The negative correlation with a higher coefficient was the analysis of “I seek excellence in everything I do”. * “When I have to do something alone, I look for company”. This result contrasts with the theory. Muñoz (2013) carried out an investigation in which strategies to improve work performance were implemented based on incentives and training. The results showed that individuals with a certain degree of affiliation perform better individually. It is important to mention that the correlation is of a slight magnitude, so its result cannot be generalized.
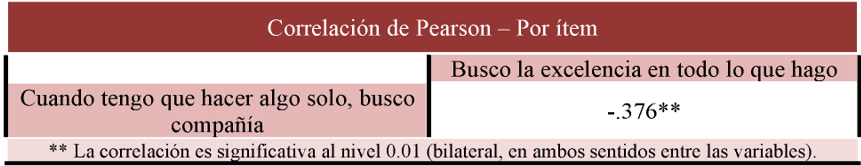
Figure 22. Pearson's Correlation - By item
Pearson correlation coefficients by dimension
Taking into account the dimensions, all possible correlation tests were carried out, with fifteen results in total; four crosses obtained a coefficient greater than 0,5; that is to say, they presented a medium or higher level of intensity, the correlation of the "Valencia" * "Affiliation" presented a coefficient of 0,711, this result is interpreted as a correlation of considerable intensity between the importance of belonging to a group and the value that the individual places on the organization's incentives. To analyze from a different perspective, the importance given to rewards, the positive result of the correlation is supported by equity theory, which establishes that the significance that individuals give to incentives depends on how equitably the same personnel perceive how they were distributed, if the worker has a high sense of affiliation, they will have an understanding of equity regarding the rewards of the organization.
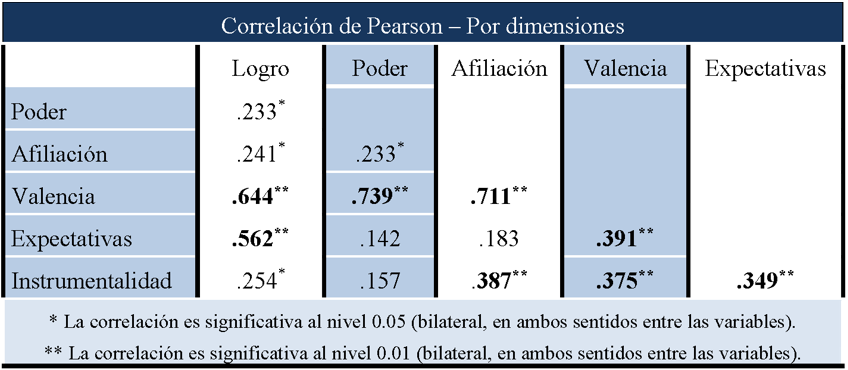
Figure 23. Pearson's correlation crosses by dimensions
The most significant correlation was that of the intersection "Valencia" * "Power,” with a coefficient of 0,739, representing a considerable average level of correlation. When contrasting the coefficient result with the descriptive analysis, a disparity in the indicators was observed, and the "Power" dimension obtained a lower degree of acceptance. This result indicates that the worker's value of rewards is directly related to the importance that the individual perceives of influencing others. We can associate this result with Maslow's theory of needs (1943). If we analyze the pyramid, self-realization, and power are at the same level, which agrees with the correlation result.
As a reference to Vroom's (1964) Expectancy Theory, the Expectancy factor is interpreted as the confidence that the worker has in his or her abilities and the development of these abilities to achieve the goals or objectives imposed by the company. In McClelland's (1953) Theory of Human Needs, satisfaction in achievement occurs when individuals achieve a goal, whether in a work or personal context. Based on these two premises, it is logical and by the theory that the intersection of "Expectations" * and "Achievement" obtains a high correlation value; the more satisfaction the achievement of goals produces, the more confidence there will be in fulfilling them.
Pearson's correlation coefficients by variable
The theoretical basis supports a positive correlation between motivation and work performance. In Chiavenato (2007), it is established that the level of performance results from the interaction of the focus of behavior and the impulse created by the desire to satisfy a need. This is shown in the form of a cyclical process of motivation. Once the desired performance is achieved and the need is satisfied, the individual begins the process again; this basic theory assumes a positive relationship: the more significant the desire to satisfy a need, the higher the level of performance.
The theory states that favorable performance outcomes depend on the relationship between persistence, intensity, and direction, persistence refers to the length of time the effort is maintained, intensity is interpreted as the strength with which the activities are carried out, the direction dictates the goal or objective on which the process is focused (Robbins, 2009), Robbins determines that there is a positive relationship between the factors that influence the motivation of the individual and work performance.
The classification of motivational factors has different theoretical perspectives, considering Maslow's hierarchy of needs theory (1943). The needs that influence motivation are ordered by physiological, safety, social, esteem, and self-actualization. Herzberg's two-factor theory determines that the factors can be divided into extrinsic and intrinsic (Ivancevich, 2015). McClelland's theory of needs (1953) proposes that motivational factors can be divided into achievement, power, and affiliation. Vroom's theory was taken as the basis for the present research.
Vroom's (1964) expectancy theory establishes the process of producing job performance with expectancy, instrumentality, and valence. Vroom proposes that when there is a positive interaction between the factors, the level of performance will be equally positive. To contrast the theory, the research results were used as theoretical premises for McClelland's theory of needs and Vroom's theory of expectations to correlate the motivational factors (achievement, power, and affiliation) with job performance (expectations, instrumentality, and valence).
The Pearson's correlation result was 0,637, with a significance level of 0,01. This coefficient is interpreted as a considerable average positive correlation between job performance and motivational factors. The theory establishes this result and confirms that motivational factors significantly influence obtaining positive job performance.
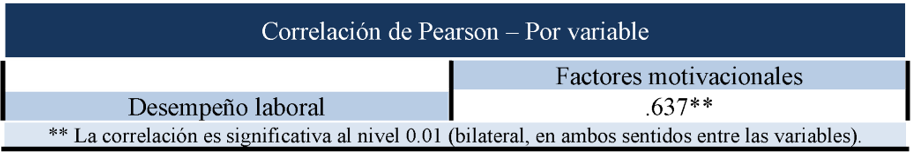
Figure 24. Pearson's correlation crosses by dimensions
Using a scatter diagram, the distribution of the data can be observed, and in the same way a trend line can be drawn, which confirms the positive correlation of the variables and offers a view of the way in which the interaction between work performance and motivational factors behaves. The coefficient of determination is 0,405, which indicates that the motivational factors constitute or explain 40,5 % of the variation in work performance.
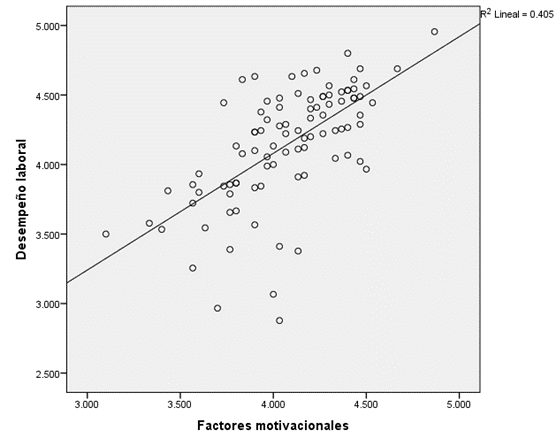
Figure 25. Scatter plot with coefficient of determination
Taking into account the coefficient of determination obtained of 0,405 and the inferential analysis of the motivational factors, it is possible to calculate an individual correlation of each factor with motivation: the need for power influences by 31,1 %, the need for achievement 35,8 % and the need for affiliation 33,1 %. Together, the three motivational factors influence work performance by 40,5 %. The relationship between motivation and performance is shown in figure 26.
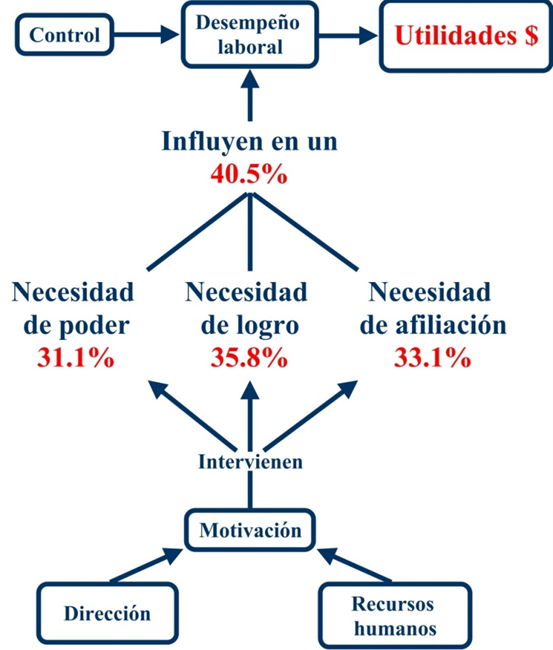
Figure 26. Diagram showing how motivational factors are determined in work performance
CONCLUSIONS
The motivational factors of the individual have a positive influence on work performance, with a correlation coefficient of 0,637, a medium-considerable level of influence is established; it is established that the satisfaction of motivational factors influences work performance, a result of 0,002 in the Chi-square statistical test, confirms that there is a significant relationship between both variables. Based on the statistical analyses, we can confirm the research hypothesis "The greater the satisfaction in the motivational factors of the individual, the greater the job performance,” therefore rejecting the null hypothesis and satisfactorily answering the research question.
The motivational factor with the most significant impact on individual behavior was "Achievement.” The achievement factor is the desire and satisfaction that the individual derives from fulfilling goals and objectives. This motivational need is the most predominant in the analyzed population. "Affiliation" represents the second factor in order of relevance for individuals. This factor is based on the desire to belong to a group and to interact socially. "Power" was the factor with the least influence; this factor is determined by the desire to control and exert influence over others; thus, by establishing the individual impact of each motivational factor on human behavior, the first specific question of the research is answered.
Achievement is directly associated with performance, the basis of this association being established by the value individuals place on completing a difficult task. Similarly, workers have a considerably high inclination to improve work performance. These two attitudes directly influence achieving better results for the organization. The second specific research question is answered by clearly and concisely determining the conditions of the association.
Due to the high impact that the need for achievement has on workers' behavior, it is recommended that emphasis and dedication be placed on creating strategies that satisfy this need. The results conclude that human resources will perform better when motivated by aspects of self-realization. Similarly, implementing programs and organizational structures focused on strengthening affiliation and power is suggested.
The factors with the least association to job performance involve issues of power. In conclusion, workers showed low motivation for tasks or situations related to having authority. Activities in which one has the responsibility of directing others or the power to exercise authority over one's colleagues were categorized as of little interest and, therefore, of low motivational influence for employees.
Since the instrumentality factor had the lowest coefficient, organizations are strongly advised to strengthen the performance-reward relationship; in other words, if the employee does not trust that performance will lead to the promised reward, this problem can cause low performance in companies. To reverse this situation, managers are advised to create reward and incentive plans with clear policies to avoid misinterpretation and mistrust on the part of the staff.
The reliability analyses and theoretical foundations with which the data collection instrument was designed and tested allow it to be used for future research. Although the instrument, designed on a Likert scale, was created for the analysis of motivational and performance factors, it can be modified and used to measure only one of the two variables.
At the end of the research, we can establish the areas of opportunity and potential that the subject of study has. Among the points that can be strengthened are the size of the sample; having more economic units open and a larger sample size would represent results with a higher degree of reliability; adding the measurement of sociodemographic parameters to the instrument would provide an opportunity for the analysis and investigation of more variables involved in job performance.
The potential of the research lies in the precedent created with the present work, which presents the basis for possible experimental research. Motivational strategies or actions can be applied in a controlled environment, and the results obtained are analyzed. Similarly, longitudinal studies can be designed to analyze the evolution of a population's motivational needs over a given period of time.
The coefficient of determination of 0,405 indicates that motivational factors influence up to 40,5 % of the variation in job performance. Individually, strategies focused on satisfying the need for achievement increase the level of motivation by up to 35,8 %, and actions aimed at satisfying the needs for affiliation and power influence motivation by 33,1 % and 31,1 %, respectively.
In conclusion, the positive influence of motivational factors on obtaining better work performance is determined, the research objective is fulfilled, and scientific material is contributed to the background of studies on motivation and work performance in Tepatitlán de Morelos, Jalisco.
BIBLIOGRAPHIC REFERENCES
1. Agut Nieto S, Carrero Planes V. Contribuciones al estudio de la motivación laboral: enfoques teóricos desde la dimensión de autoexpresión del ser humano. Rev Psicol Trab Organ. 2007;23(2):203-25.
2. Álvarez Ramírez LY. Escala de motivación adolescente (EM1) basada en el Modelo Motivacional de McClelland. Tesis Psicológica. 2012;7(1909–8391):128-43.
3. Arriaga Huerta LM, López Ruiz C, Olivares Baltazar R. Pymes: contribuciones a la economía y competitividad en México; 2007.
4. Barrientos Sánchez J. La motivación del personal de enfermería, en relación con la satisfacción del usuario desde la perspectiva del familiar [Tesis]. Universidad Nacional Autónoma de México; 2012.
5. Carballé Piñón R de los Á. Estrategia para elevar la motivación laboral; factor imprescindible para mejorar nuestra productividad. Rev Infociencia. 2015;19(4):1-12.
6. Chiavenato I. Administración de recursos humanos: el capital humano de las organizaciones. 8a ed. México: McGraw-Hill Interamericana; 2007.
7. Chiavenato I. Comportamiento organizacional: la dinámica del éxito en las organizaciones. 2a ed. México: McGraw-Hill Interamericana; 2009. https://doi.org/10.1017/CBO9781107415324.004
8. Contreras Montoya MA. Influencia de factores de higiene y motivación en la satisfacción laboral, en el interés por salir, así como en el interés por permanecer en la empresa; bajo un modelamiento estructural de trayectorias, en personal que labora en una empresa manufacturera [Tesis]. Universidad Nacional Autónoma de México; 2016.
9. Cortés Mejía A. Estilos de liderazgo y motivación laboral en el ambiente educativo. Cienc Soc. 2005;106(1):203-14.
10. Díaz Chimba R. Capacitación y desempeño laboral de los empleados de la Comisión Federal de Electricidad de la Zona Montemorelos-Linares, Nuevo León [Tesis]. Universidad de Montemorelos; 2015. https://doi.org/10.1017/CBO9781107415324.004
11. Domínguez Mata JJ. Importancia de los factores de la personalidad que influyen en la motivación y su relación con el desempeño laboral; 2001.
12. Fidias A. El proyecto de investigación. 6a ed. Caracas: Editorial Episteme; 2012.
13. Flores Villarreal S. Factores psicosociales y sociodemográficos que influyen en el rendimiento laboral y su relación con la motivación: un caso empresarial [Tesis]. Universidad Autónoma de Nuevo León; 2011.
14. García Sanz V. La motivación laboral: estudio descriptivo de algunas variables [Tesis]. Universidad de Valladolid; 2012. Disponible en: https://uvadoc.uva.es/bitstream/10324/1144/1/TFG-B.60.pdf
15. Hernández Junco V, Quintana Tápanes L, Guedes Díaz R, Mederos Torres R, Sablón Cossío N. Estudio de la motivación, la satisfacción laboral, el liderazgo, la cultura organizacional y la calidad del servicio existente en el hospital Mario Muñoz Monroy. Folletos Gerenciales; 2005.
16. Hernández Sampieri R, Fernández Collado C, Baptista Lucio MP. Metodología de la investigación. 6a ed. México: McGraw-Hill Interamericana; 2014.
17. Hernández V, Quintana L, Mederos R, Guedes R, García B. Motivación, satisfacción laboral, liderazgo y su relación con la calidad del servicio. 2011;1:1-8.
18. Hernández y Rodríguez S. Administración: origen, evolución y vanguardia. 4a ed. México: McGraw-Hill; 2002.
19. Herzberg F. La teoría de la motivación-higiene. The World Publishing Company; 1954. Disponible en: https://www.mendeley.com/viewer/?fileId=1927e89b-0c9b-7c0d-2576-b4a619dd9508&documentId=73e83f7d-ac1e-3d67-bd1a-4650d1ab3bec
20. Instituto de Información Estadística y Geográfica de Jalisco (IIEG). Tepatitlán de Morelos, diagnóstico del municipio; 2018.
21. Ivancevich JM, Konopaske R, Matteson MT. Comportamiento organizacional. 7a ed. México: McGraw-Hill Interamericana; 2015. https://doi.org/10.1016/S1665-7063(14)70928-5
22. Jaén Díaz M. Predicción del rendimiento laboral a partir de indicadores de motivación, personalidad y percepción de factores psicosociales [Tesis]. Universidad Complutense de Madrid; 2010.
23. Koenes A. Gestión y motivación del personal. Madrid; 1996.
24. Likert R. A technique for the measurement of attitudes. Arch Psychol. 1932.
25. López J. Motivación laboral y gestión de recursos humanos en la teoría de Frederick Herzberg. Gestión Tercer Milenio Rev Investig Fac Cienc Adm UNMSM. 2005;8(15):25-36. Disponible en: http://revistasinvestigacion.unmsm.edu.pe/index.php/administrativas/article/view/9692/8498
26. Martínez Ziranhua MG. Adaptación de un modelo de motivación para mejorar el desempeño laboral de los trabajadores de una pequeña empresa [Tesis]. Universidad Nacional Autónoma de México; 2009.
27. Maslow AH. A theory of human motivation. Psychol Rev. 1943;50(4):370.
28. McClelland DC, Atkinson JW, Clark RA, Lowell EL. The achievement motive. Century Psychology Series; 1953.
29. Münch Galindo L. Fundamentos de administración: casos y prácticas. México: Editorial Trillas; 1997. Disponible en: http://www.upg.mx/wp-content/uploads/2015/10/LIBRO-8-Fundamentos-de-Administracion-Lourdes-Münch-Galindo.pdf
30. Münch Galindo L. Administración. 2a ed. México: Pearson Educación; 2014.
31. Muñiz M. Estudios de caso en la investigación cualitativa. División de Estudios de Posgrado. Universidad Autónoma de Nuevo León, Facultad de Psicología; 2010.
32. Muñoz Lara AM. Estrategias para mejorar el desempeño laboral a través de incentivos y capacitación en los empleados de las agencias aduanales de la delegación Gustavo A. Madero; 2013.
33. Ogliastri E. Tiros en la cara. El delincuente violento de origen popular. Caracas: Ediciones IESA; 2008.
34. Palma Carrillo S. Motivación y clima laboral en personal de entidades universitarias. Rev Investig Psicol. 2000;3(11):11.
35. Perilla Toro LE. David C. McClelland (1917-1998). Rev Latinoam Psicol. 1998;30(3):529-32.
36. Robbins SP, Coulter M. Administración. 8a ed. México: Pearson Educación; 2005.
37. Robbins SP, Judge TA. Comportamiento organizacional. 13a ed. México; 2009.
38. Rodríguez VV. Motivación: herramienta definitiva. Agro Enfoque. 2015;29(197):4. Disponible en: http://search.ebscohost.com/login.aspx?direct=true&db=bth&AN=101391492&lang=es&site=bsi-live
39. Rojas L, Berríos M, Sanz B, Prada M. Perfil motivacional y talento humano de la Escuela de Nutrición y Dietética. Univ Andes. Rev Fac Med Univ Andes. 2013;22(2):104-10.
40. Rosas Chacón A. La motivación laboral en el desempeño de los funcionarios del servicio profesional electoral del Instituto Federal Electoral en el Distrito Federal [Tesis]. Universidad Nacional Autónoma de México; 2008.
41. Saavedra ML, Tapia B. El entorno sociocultural y la competitividad de la PYME en México. Panorama Socioeconómico. 2012;44:4-24.
42. Salazar Amador S. Motivación y satisfacción laboral: factores que influyen en las mujeres [tesis]. Universidad Nacional Autónoma de México; 2005.
43. Salazar Estrada JG, Guerrero Pupo JC, Machado Rodríguez YB, Cañedo Andalia R. Clima y cultura organizacional: dos componentes esenciales en la productividad laboral. Acimed. 2009;20(4):67–75.
44. Steers RM, Braunstein DN. A behaviorally-based measure of manifest needs in work settings. J Vocat Behav. 1976;9(2):251–66.
45. Sudarsky J, Cleves J. Diseño de un instrumento para medir el perfil motivacional. Rev Latinoam Psicol. 1976;8(3):425–77.
46. Sum Mazariegos MI. Motivación y desempeño laboral [tesis]. Universidad Rafael Landívar; 2015. https://doi.org/10.1017/CBO9781107415324.004
47. Taylor FW. Los principios de la administración científica. Barcelona; 1911.
48. Ugalde Binda N, Balbastre Benavent F. Investigación cuantitativa e investigación cualitativa: buscando las ventajas de las diferentes metodologías de investigación. Rev Cienc Econ. 2013;31(2):179–87. Disponible en: http://www.revistas.ucr.ac.cr/index.php/economicas/article/view/12730
49. Velasco Lince EM, Bautista Santos H, Sánchez Galván F, Cruz Rivero L. La motivación como factor de influencia en el desempeño laboral del área docente del Instituto Tecnológico Superior de Tantoyuca [tesis]. Instituto Tecnológico Superior de Tantoyuca; 2012. Disponible en: http://www.eumed.net/libros-gratis/2011c/992/index.htm
50. Villarreal Larrinaga O, Landeta Rodríguez J. El estudio de casos como metodología de investigación científica en dirección y economía de la empresa. Investig Eur Dir Econ Empresa. 2010;16(3):31–52. https://doi.org/10.1016/S1135-2523(12)60033-1
51. Vroom V. Motivation and work. John Wiley & Sons; 1964.
FINANCING
None.
CONFLICT OF INTEREST
Authors declare that there is no conflict of interest.
AUTHORSHIP CONTRIBUTION
Data curation: Benjamín Villegas Alcántar.
Methodology: Benjamín Villegas Alcántar.
Software: Benjamín Villegas Alcántar.
Writing – original draft: Benjamín Villegas Alcántar.
Writing – review and editing: Benjamín Villegas Alcántar.