doi: 10.56294/mw2024538
ORIGINAL
Implementing a multi-omics graphical model to explore the genetic causes of co-morbid illnesses caused by ageing
Aplicación de un modelo gráfico multiómico para explorar las causas genéticas de las enfermedades comórbidas causadas por el envejecimiento
Chandan Das1 ![]() , Nagireddy Mounika2
, Nagireddy Mounika2 ![]() , Shikhar Gupta3
, Shikhar Gupta3 ![]() , Nimesh Raj4
, Nimesh Raj4 ![]() , Deepak Malla5
, Deepak Malla5 ![]() , Naresh Kaushik6
, Naresh Kaushik6 ![]()
1IMS and SUM Hospital, Siksha ‘O’ Anusandhan (Deemed to be University), Department of General Medicine, Bhubaneswar, Odisha. India.
2Centre for Multidisciplinary Research, Anurag University, Hyderabad, Telangana. India.
3Chitkara Centre for Research and Development, Chitkara University, Himachal Pradesh. India.
4Centre of Research Impact and Outcome, Chitkara University, Rajpura, Punjab. India.
5Noida International University, Department of General Medicine, Greater Noida, Uttar Pradesh. India.
6ATLAS SkillTech University, Department of uGDX, Mumbai, Maharashtra. India.
Cite as: Das C, Mounika N, Gupta S, Raj N, Malla D, Kaushik N. Implementing a multi-omics graphical model to explore the genetic causes of co-morbid illnesses caused by ageing. Seminars in Medical Writing and Education. 2024; 3:538. https://doi.org/10.56294/mw2024538
Editor: PhD. Prof. Estela
Morales Peralta ![]()
Corresponding author: Chandan Das *
ABSTRACT
Alanine-Aminotransferase (ALAT) and Gamma-glutamyl Tran peptidase (GGT) indicators are found in the liver. They merged aging and illness to identify molecular pathways underlying age-related illnesses and associated co-morbidities. Markers from the epigenomics, transcriptomics, glycemic, and metabolomics subsets of four separate large-scale omics datasets were merged using the 510 people of the twin’s registry, with a complete collection of illness symptoms. By removing mediated connections, they evaluated depending connections between omics markers and phenotypes using visual random forests. A model with 7 elements that each represents a distinct aspect of ageing is created by including this ground-breaking technique for the integration of multi-omics data. These parts are linked by centers that can cause age-related illness co-morbidities. They pointed to urate as one of these crucial factors that can affect the co-morbidity of renal disease with body structure and weight. The synthesis of the oxytocin hormone links the body structure-related factors to inflammatory Immunoglobulin G (IgG) signs. Therefore, the ongoing low-grade inflammation that often follows obesity can be facilitated by oxytocin. Their multi-omics graphical model shows aging-related biological markers that can contribute to illness co-morbidities and illustrates the interconnectedness of age-related disorders.
Keywords: Co-Morbidities; Autism Spectrum Disorders; Oxytocin; Symptoms; Glomerular Filtration Rate.
RESUMEN
Los indicadores Alanina-Aminotransferasa (ALAT) y Gamma-glutamil Tran peptidasa (GGT) se encuentran en el hígado. Se fusionaron el envejecimiento y la enfermedad para identificar las vías moleculares subyacentes a las enfermedades relacionadas con la edad y las comorbilidades asociadas. Los marcadores de los subconjuntos de epigenómica, transcriptómica, glucemia y metabolómica de cuatro conjuntos de datos ómicos a gran escala independientes se fusionaron utilizando las 510 personas del registro de gemelos, con una colección completa de síntomas de enfermedad. Al eliminar las conexiones mediadas, evaluaron las conexiones dependientes entre los marcadores ómicos y los fenotipos utilizando bosques aleatorios visuales. Se crea un modelo con 7 elementos que representan cada uno un aspecto distinto del envejecimiento mediante la inclusión de esta técnica innovadora para la integración de datos multiómicos. Estas partes están vinculadas por centros que pueden causar comorbilidades de enfermedades relacionadas con la edad. Señalaron el ácido úrico como uno de estos factores cruciales que pueden afectar a la comorbilidad de la enfermedad renal con la estructura corporal y el peso. La síntesis de la hormona oxitocina vincula los factores relacionados con la estructura corporal con los signos inflamatorios de la inmunoglobulina G (IgG). Por lo tanto, la inflamación continua de bajo grado que suele seguir a la obesidad puede verse facilitada por la oxitocina. Su modelo gráfico multiómico muestra marcadores biológicos relacionados con el envejecimiento que pueden contribuir a las comorbilidades de la enfermedad e ilustra la interconexión de los trastornos relacionados con la edad.
Palabras clave: Comorbilidades; Trastornos del Espectro Autista; Oxitocina; Síntomas; Tasa de Filtración Glomerular.
INTRODUCTION
Numerous characteristics, including senior age, male sex, and non-white origin, have been identified by epidemiologic research as being linked to unfavorable clinical outcomes, including hospitalization. More serious injury is also linked to the existence of physical co morbidities such as obesity, diabetes, and heart disease.(1) When it comes to a rise in hospitalizations and a generally decreased life expectancy, medical co-morbidities (MCs) are a considerable burden for those with extreme mental illnesses like schizophrenia (SZ) in addition to psychotic disorders and bipolar disorder(BD).(2) Essential symptoms of a co-morbid sickness, a second-order categorization, are distinct from those of the underlying condition. Co-morbidity far more often affects people compared to the general population, with autism spectrum disorders (ASD). Co-morbid disorders can be indicators of the pathophysiology at play and need a more complex therapy strategy.(3) However, Intellectual disability and co-occurring medical conditions are far more likely to result in a greater mortality rate risk associated with ASD than does ASD alone. People who struggle with ASD are much more likely than the general population to have co-morbidity. Obsessive behavioral illness is one of several mental co-morbidities that have been regularly described in patients with SZ. Information suggests that obsessive-compulsive disorder can influence the course of illness in both bipolar disorder and schizophrenia, while in other instances; antipsychotics have been found to cause and signs of it. These co-morbidities make SZ medication is more difficult, which is already difficult. The symptom of obsessive-compulsive disorder (OCD), a co-morbid illness with SZ, has not received enough attention.(4) Patients with painful mental disorders had co-morbid illnesses like cardiovascular disease (CVD) or Diabetes Mellitus (DM) at significantly higher rates than the general population, which led to a higher reflection of adverse cardiovascular events and a 10- to 20-year shorter life span. For additional research, the socio-demographic data of the patients, such as their age, gender, and ethnicity, and their medical information, such as the nature of their disease, the time it was diagnosed, and the date of their death (if relevant), were gathered.(5)
According to the author to determine co-morbidities and a step-by-step logistic regression (LR) method, hazards for COVID-19 progression and deaths were found in COVID-19 patients lacking chronic co-morbidities.(6) To determine if co-morbidities were common and how severe they were among COVID-19 patients who had been hospitalized at a therapy facility.(7) To investigated connections between mental co-morbidity and the results of pharmacologic therapy for Disorders of Gut–brain Interaction (DGBI). Interactions between mental illness were examined in a retrospective analysis to a neuro gastroenterology center in 2016 with follow-up until 2018.(8) Since the researchof reliable forecasts of people who would pass away shortly while receiving dialysis can be helpful to patients, healthcare professionals, and the public in deciding whether to begin dialysis.(9) To investigate the relationship between both mental and physical diseases and their individual combined effects on work loss.(10) The initial step in the researchwas to determine whether the genes that are currently being addressed by Attention-Deficit/Hyperactivity Disorder (ADHD) medications are associated with the disease and/or its co-morbidities. The second goal was to find the pathways and genes that play a part in the biological processes that underlie ADHD and that can be affected by medications.(11) The goal of the researchis to find out whether periodic treatment can enhance knee function and physical activity in individuals with obesity and knee osteoarthritis (OA) using a favorable modification of the gut microbiota. The investigation depends on a double-blind, placebo-controlled, randomized experiment.(12) To looked at the connections between pain being disabled and post-traumatic stress symptoms (PTSS).(13) Surveys measuring pain interference, Post-traumatic Stress Symptoms (PTSS), panic prevention, and pain self-efficacy were completed by 50 patients with chronic pain. The Insomnia Severity Index (ISI) before and after therapy. Participants recorded their daily sleep and symptom counts for anxiety and arousal.(14) The clinical files of 120 Latinx people who had been ordered for a mental health evaluation during a primary care visit were examined. The prevalence of stress, sadness, and anxiety was all considerably greater among those who satisfied the criteria for partial- or full PTSD, which represented about two-thirds of the population.(15)
MATERIAL AND METHOD
Data Acquisition and Processing
Around hospital trips, anthropometric measurements and interviews were used to gather the phenotypic data. Markers from the epigenomics, transcriptomics, glycemic, and metabolomics subsets of four separate large-scale omics datasets were merged using the 510 people of the twin’s registry, with a complete collection of illness symptoms. Four other high-throughput omics datasets were also examined. Network analysis is not possible with dozens of Hundreds and thousands of CpG sites, thousands of Ribonucleic acid (RNA) transcripts, and determined compounds in particular. To remove unnecessary parameters from each dataset, they used a knowledge-driven method. To do this, they only chose factors that have previously been shown to have a strong correlation with chronological age.
Epigenomics
As earlier indicated, the HumanMethylation 450 Bead Chip was applied to find the levels of DNA methylation in the lipid components. The information was adjusted for using logistic mixed effect models and the beta mixture quantile dilation (BMIQ) method, technological variations were used to adjust it for batch impact and degrees of sulfate conversion. The ability to accurately estimate chronological age using just three aging-related differentially methylated regions (aDMRs) has been displayed.
Transcriptomics
In the MuTHER experiment, as previously mentioned, RNA quantity was assessed by employing the Human HT-12 V3 Beads microarray from Illumina, in collections of belly fat. Before analysis, there was a substantial correlation between 188 genes (199 probes) and chronological years, and linear models were used to modify the query strength for batch effects. To choose expression probes that were independently related to age used stepwise regression. For a complete list of the 24 sensors from 24 distinct genes that were left behind.
Glycomics
The high-throughput IgG glycan measurements were performed for this work. In a nutshell, 90 l of plasma was used to isolate IgG, which was then released, tagged with 2-amino benzamide, and subjected to Ultra Performance Liquid Chromatography (UPLC) analysis. The 24 glycan constructions are represented by the 24 glycan peaks (GP), which were separated into the matching chromatograms. The data has already been thoroughly explained. Using ComBat, Glycan peak global normalization, record transformation, and group effect correction were performed. Three IgG glycosyl structures GP6, GP14, and GP15 have been discovered to communicate with a range of aging-related disorders and clarify 58% of the variance in age. They chose these three architectures for network research.
Metabolomics
The metabolic patterns from plasma and serum materials were measured using gas chromatography–mass spectrometry (GC/MS) and Liquid chromatography–tandem mass spectrometry (LC/MS) without a specific objective, respectively. A unique database was then used to identify the compounds involved. The run-day median was used to scale metabolite amounts, and the run-day least was used to impute them reverse accepted as normal, and batch effects were corrected for on the assumption that linear combined algorithms with the cohort as the random predictor. In many large population research investigations, it was determined that around half of all blood metabolites found were connected to chronological age. They chose 22 of these metabolites since they have together account for 59 % of the variance in age in chronological order.
Clinical Phenotypes
The previously released omics data were merged with 92 phenotypes. They additionally included 13 physical parameters, together with the chronological age, using DXA (Dual-energy X-ray Absorptiometry) evaluated. In addition to DXA, they used preset body composition metrics, including BMI (body mass index), waist, hip, and weight. The FVC (forced vital capacity) and FEV1 (forced expiratory volume in one second) were calculated using conventional spirometry to assess lung function. The biochemical ALAT (assays Alanine Aminotransferase) and GGT (Gamma-Glutamyltransferase) were employed to assess liver function. Additionally, they used serum creatinine to compute the glomerular filtration rate (eGFR), a marker of a kidney feature. Also included were results from past studies that examined ailments including arthritis, asthma, and chronic pain. Aside from that, inquiries were utilized to gather lifestyle data. They compiled information on diet and physical exercise, among other things. Data on food consumption were gathered using a recognized food frequency questionnaire. Using principal component analysis, item counts were combined into 54 food categories and converted into orthogonal designs. To represent five distinct eating patterns in their model, they selected the first five main components each trait is listed in full.
Data Pre-Processing
They eliminated examples that had errors of more than 20 %, and they also eliminated variables that had missing values of more than 20 %. The mouse package was used to calculate the last missing data. The categorical variables were dichotomized, and all constants underwent inverse normalization. To take family ties into account, they eliminated the corresponding node from the system before analysis and introduced a variable that gives an individual identification code for each family while doing network estimation.
Network Inference
The combined visual structure was inferred using the complementary pair’s stability selection (CPSS) variation of the Graphics Random Forest (GRaFo) method. In a nutshell, the remaining variables were prioritized for each variable based on the conditional dependency determined by the random forest (RF) variable significance. As a consequence, for each set of xandy variables, two ratings were created: one according to the factor’s significance of y for predictions made by x, and the other on x relevance to y. Following the inclusion of the top rating pairs as graphical design edges, the pair’s rank was determined by taking the worse of these two ratings. This process was applied to 100 randomly selected data subsets, each of which included one-half of the total entries and its opposite set. Utilizing CPSS65, 200 created visual representations were combined to manage the family-wise error rate (FWER). To guarantee FWER, edges were included in the final model and were found in more than 80 % of all complimentary pairings. An edge in their model’s indication cannot be estimated using the effect of contractors from the rough forest. In mixed models, individual impacts often depend on other model variables and are non-linear. They used regression models to infer the signals by regressing each variable against each other to visualize the results.
Network Analysis
The visual design has a set of edges E and a set of verticesV, which was examined as an unstructured, unbiased network, or G= (V,E). Several metrics were developed to evaluate the significance of the network’s nodes. How many edges there are between a certain node, orv, is known as the node’s degree, which measures its direct relationships. The percentage of edges in the network that are present in the neighborhood of v is known as the clustering coefficient. It gauges how influential v is in the immediate area. Conversely, the between centrality evaluates the relevance of v for the strength of the network while taking into account it is via links. The percentage of all shortest routes that include version 12 is how it is described. Densely linked parts, also known as groups or communities, which stand in for the network’s operational elements, are a common feature of real-world networks. They employed a method that was objective and devoid of the kind of variable to find clusters inside model. The flexibility rank increases as there are more intra-cluster connections and decreases as there are more inter-cluster links, and is optimized. Despite the significant several biological systems are defined by local clustering by short average route lengths between vertices. Tiny world networks are the name given to these networks.
Network Stability
First, this researchevaluated how robust and whenever the side breadth criteria were altered, node centrality and component allocations were made. To do this, they created several models by incorporating connections that, when 80% reflected the original method, were present in 20 %, 40 %, 60 %, 80 %, and 100 % of the subsamples, correspondingly. Additionally, they examined a structure that included each edge that appeared in at least one subsample and was given a rating. The relationship among the original approach moreover, the model for various edge types for node degrees and clustering factors thresholds was calculated as an indicator of the robustness of node importance. The updated RAND index contrasts the primary age-mgm’s seven network components with assumed-network modules found using different edge cutoffs, which were computed to evaluate the durability of module allocations. The RAND index counts the deals among two distinct segment assignments and adjusts to reflect the number of agreements that would be predicted by accident to determine how similar the two module assignments. A number around 0,0 indicates discrepancies between the assigned modules of two networks, whereas a modified RAND index near 1,0 implies convergence. They also contrasted the background distribution of the systems’ adjusted RAND indices for the different edge cutoffs with 1000 randomly chosen module allocations. Second, they looked at the network’s strength, specifically how the component assignments varied based on the omics factors that were pre-selected before the model construction. The same information was used to create a second model; however, this model contained all metabolomics variables with known chemical identities, eliminating the need for variable selection to gather metabolomics data to analyze the impact of this selection step in their findings. The network is complete with 1153 vertices and 342 nodes, including 146 from the original model and 198 more nodes. There are 272 relationships between the primary variables, 254 of which were discovered in the original technique, and 707 edges amongst new compounds, of which 707 link a single new metabolite with one classic variable. On average, 58 % of the big network’s portions include the 65 connections that the big one lacks compared to the original model, indicating that their exclusion was owing to the network’s inadequate power. Additionally, 161 of the 175 vertices linking the new chemicals with the initial variables were made up of metabolites, while the last 14 connections included either circulating lipid measures or kidney function; they find that the additional metabolites are mostly peripheral to the age-mgm.
RESULTS AND DISCUSSION
By combining chosen age-associated signs and four distinct omics datasets with 92 clinically determined symptoms and 510 women, ranging in age from 34 to 84, volunteered data based on a mixed graphical model was derived. The final model consists of 316 uncontrolled edges linking 145 unstructured nodes. The majority of the nodes (96) group together to create one sizable linked component that they will use the term age-MGM (Age-Molecular Genetics and Metabolism) from two separate pairs of nodes, 33 disconnected nodes, and two smaller parts (four and eight nodes) all include variables linked to pain and memory function. Figure 1 shows a selection of the graphical model’s modules1(a) the immediate vicinity of chronological age. 1 (b) OXT (Oxytocin), a type of hormone, mediates the relationship between the GP14 is an IgG glycosylation marker and the number of fat factors and age. 1(c) Phosphodiesterase 4C, DHEA-S (Dehydroepiandrosterone-Sulfate), and GP14 (Glycan Peak 14) are three omics markers found inside the immediate neighborhood forceful heart rate and FVC and forceful expiratory volume in one second (FEV1) are used to test lung function.
Figure 1 shows a selection of the graphical model’s modules: a) The immediate vicinity of chronological age, b) OXT, a type of hormone, mediates the relationship between the Marker for IgG glycosylation, GP14 and the number of fat factors and age, c) Phosphodiesterase 4C, Dehydroepiandrosterone-Sulfate (DHEA-S), and Glycan Peak 14 (GP14) are three omics markers found inside the immediate neighborhood forceful heart rate (FVC) and forceful expiratory volume in one second (FEV1) are used to test lung function.
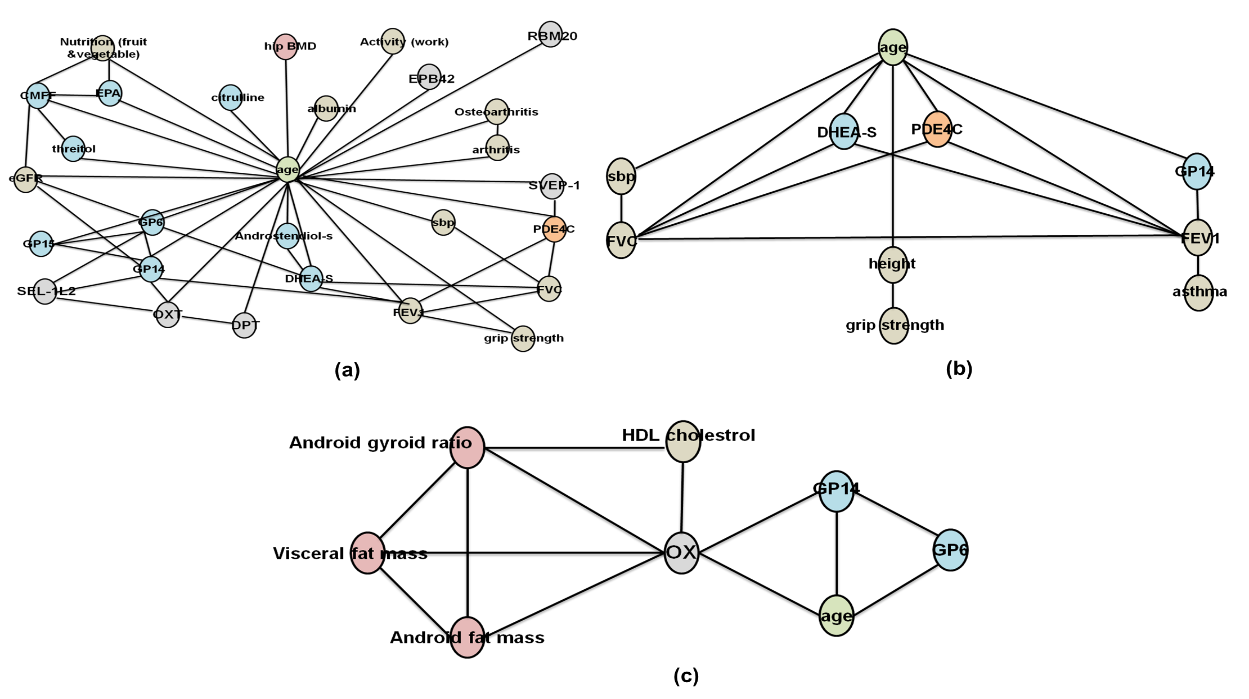
Figure 1. Network analysis
Age-mgm Topological Properties
The 96 variables in the age-mgm large interconnected component, which also contains elements from each of the four omics datasets, are connected by 286 connections. Moreover, it has a local clustering coefficient of 46,6 %, an expected node degree of 6,0, and an actual shortest route distance of 3,2. It also has a modest globe index, a small-world system with significant regional clustering and short travel durations are another way to conceptualize the age-mgm. Figure 2 and table 1 indicates the Co-morbid illness based on ages.The network has a distant feel even when age is removed. The node with the most connections is called age, as would be predicted. Regardless of its modest clustering coefficient (8,0 %), it has a high degree of centrality (47,5 %). This suggests that although its neighbors are often disconnected, age unites multiple clusters. Age acts as the age-mgm’s central node with a typical shortest size of 2,1.
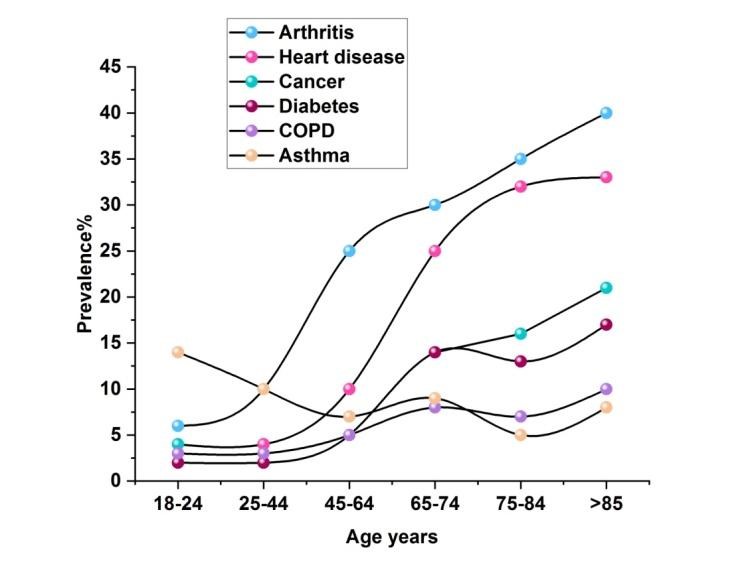
Figure 2. Co-morbid illness symptoms based on ages
|
Table 1. Numerical outcomes for Co-morbid disease symptoms according to age |
||||||
|
Age years |
Prevalence (%) |
|||||
|
Arthritis |
Heart disease |
Cancer |
Diabetes |
COPD |
Asthma |
|
|
18-24 |
6 |
4 |
4 |
2 |
3 |
14 |
|
25-44 |
10 |
4 |
- |
2 |
3 |
10 |
|
45-64 |
25 |
10 |
- |
5 |
5 |
7 |
|
65-74 |
30 |
25 |
14 |
14 |
8 |
9 |
|
75-84 |
35 |
32 |
16 |
13 |
7 |
5 |
|
>85 |
40 |
33 |
21 |
17 |
10 |
8 |
The age-MGM’s modularity
When compared to them, there are a lot of edges separating and linking variables from the same omics dataset. Particularly dense clusters, each having 37 and 34 edges are produced by the metabolomics and transcriptomics variables. In comparison, there are just 7 vertices that link the variables from transcriptomics & metabolomics with other variables from other omics sets. Identical to this, Dual-energy X-ray Absorptiometry (DXA)’s discovery of structural percentage variables are connected by 45 edges. They employed a modularity-based cluster discovery tool to analyze the network topology objectively. This method produced seven modules. All except three of the gene expression indicators are present in the first cluster (EXPRESSION), which has the highest centrality (10,5 %) among the clusters. It has six edges extending outward and is primarily associated with neighboring clusters in the network. They used a modularity-based cluster discovery approach to objectively analyze the network structure. Seven modules were produced using this method. All gene expression markers aside from three are present in the first group (EXPRESSION). The body composition variables are divided into two groups: one group contains factors linked to lean mass and fat, while the other group contains variables linked to bone density (BONE). All connections between the LUNG cluster, which also includes the age variable, the FAT cluster, the BONE cluster has a tight relationship with the LUNG cluster. The majority of the genes that govern it come from adipose tissue. Alanine-Aminotransferase (ALAT) and Gamma-Glut amyl Tran peptidase (GGT) are liver indicators found in the cluster (LIVER) below; this also includes some amino acids, cholesterol, and triglycerides. C-glycosyl-tryptophan is the center of the metabolite cluster and has nine edges. Still, the metabolomics cluster’s primary link to age and IgG glycosylation indicators is the eGFR (degree 7). Beyond the LUNG cluster through age, the only other linkages between the renal cluster and the remaining clusters are the edges between the FAT and LIVER clusters and urate. As shown in figure 3 and table 2, an examination of kidney function using blood is called a GFR (glomerular filtration rate).
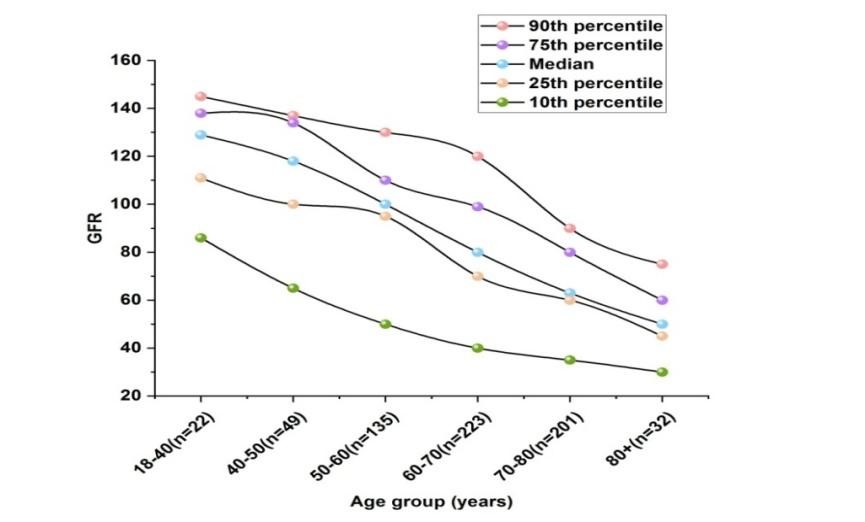
Figure 3. GFR comparison
|
Table 2. Numerical outcomes for rate of Glomerular Filtration |
|||||
|
Age group (years) |
GFR |
||||
|
90th percentile |
75th percentile |
Median |
25th percentile |
10th percentile |
|
|
18-40(n=22) |
145 |
138 |
129 |
111 |
86 |
|
40-50(n=49) |
137 |
134 |
118 |
100 |
65 |
|
50-60(n=135) |
130 |
110 |
100 |
95 |
50 |
|
60-70(n=223) |
120 |
99 |
80 |
70 |
40 |
|
70-80(n=201) |
90 |
80 |
63 |
60 |
35 |
|
80+(n=32) |
75 |
60 |
50 |
45 |
30 |
When a GI bleed was followed by a second TE incidence, the median time between episodes was 5 months. When patient’s GI bleed was taken into account as a time-dependent covariate, there was a higher chance that they would have a following TE event (exposure ratio [HR] = 14 7,4 [95 % assurance interval CI 4,9 to 11,1], (p 0,001)). The generally incidence of GI bleed, TE episodes, and risk connecting the two occurrences be shown in table 3 for the age ranges of 50 years, 50 to 70 years, and 470 years. The connection between a GI bleed and a future TE incident became better in terms of increasing risk as the patient’s age increased. Overall cohort survival is shown in figure 4. When they were looked at as time-dependent factors, the incidence of a GI bleed and a TE episode had no negative effects on late survival (HR =14 0,72 [95 % CI 0,4 to 1,2], p 14 0,1 and (HR 14 0,84 [0,5 to 1,3], p = 14 0,43) respectively.
|
Table 3. Numerical outcomes for Serum levels of urate (mmol/L) |
||
|
Time(weeks) |
Serum urate (mmol/L) |
|
|
Placebo |
Inosine |
|
|
0 |
0.27 |
0.28 |
|
6 |
0.28 |
0.46 |
|
13 |
0.26 |
0.42 |
|
19 |
0.25 |
0.41 |
|
26 |
0.24 |
0.38 |
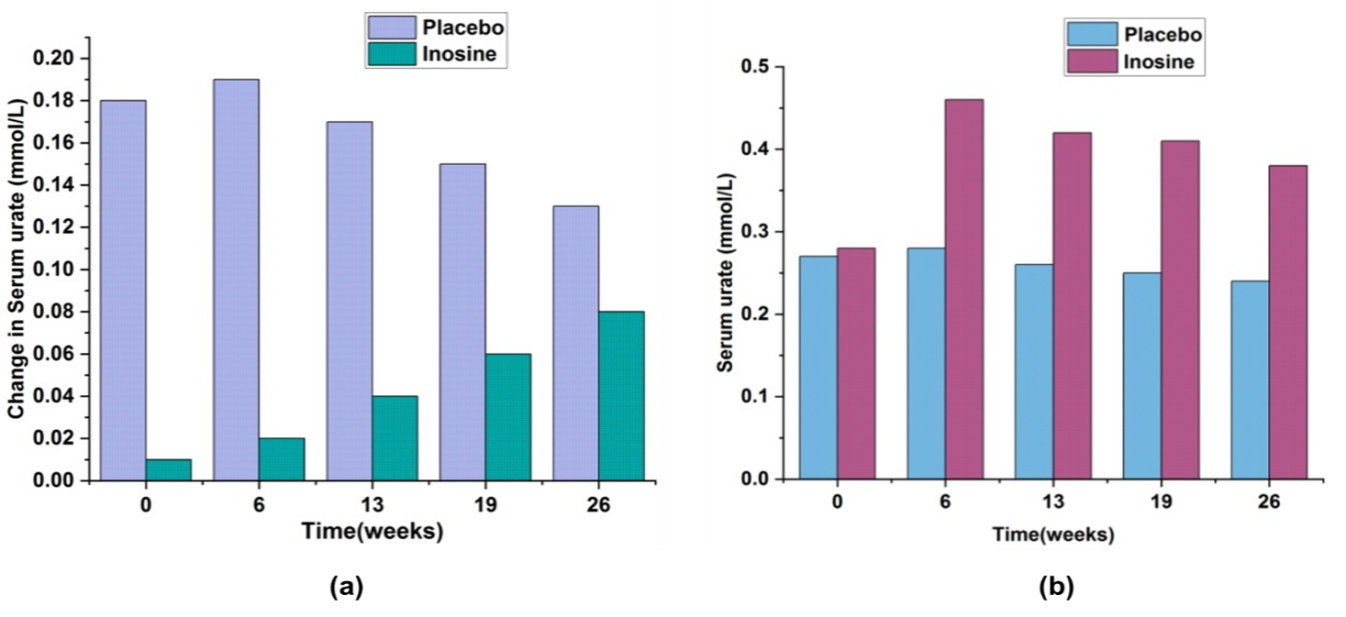
Figure 4. a) Modification of urate serum levels (mmol/L), b) Serum levels of urate (mmol/L).
Stability of the AGE-MGM
To determine the durability of their approach, they discovered new networks using a variety of edge conditions, including cutoffs and a modified set of omics variables. When contrasting those networks to original model, they discovered that node centrality and module assignments remained constant regardless of the edge inclusion threshold. In addition to the 23 pre-selected metabolites, the calculation approach is based on 196 additional metabolites or when using each of the metabolomics variables with established chemical identities, the original age-mgm’s modules were retained. They combined the first and second twins of each family, in turn, to produce two separate models from disparate datasets, to assess the repeatability of the predicted distinct set of age-MGM cases. These models were evaluated in comparison to the initial network.In this work, researchers used information gathered from 510 twins’ registry women to build a plausible by merging illness symptoms and molecular markers on four omics layers, a multi-omics graphic model of age-related diseases can be created. Since their model is sparse and does not include mediated linkages, the majority of the factors still form one linked component (age-mgm) that is made up of seven modules. It’s interesting to note that every single one of these components reflects a distinct component of ageing, such as metabolic ageing associated with a deterioration in renal function (KIDNEY cluster). The model shows how age-related disorders have multivariate dependencies that can help to understand co morbidity trends. The presence of an edge in their model denotes reliant dependency among two variables, but its absence denotes conditional independence between the two variables given the other variables in the model.
Lung Health Is a Key Aspect of Ageing
Measures of lung function such as FEV1 and FVC, as well as age-mgm, suggest that lung function is an important factor in ageing, are correlated with three distinct omics indicators, and apart from age, are some of the LUNG cluster’s nodes with a lot of connections:(i) One of the most common chemicals in humans, Dehydroepiandrosterone Sulphate (DHEA-S), is known to decline with ageing and has even been proposed as a potential anti-aging medication.
Age-Related Renal Dysfunction Correlates with Metabolic Change
Age has been reported to have a significant impact on the human metabolome in various investigations. Very four of the 13 age-associated metabolites in the age-MGM are directly connected to age; the other nine metabolites are very weakly related to age. These 13 metabolites are grouped in one big cluster. The fastest route to age for six of these nine metabolites is via eGFR (as shown in figure 3), a measurement of renal function. Age is the single unmodifiable variable in unstructured model, despite this. They thus postulate that as they age, renal function diminishes which produces a significant change in the ageing blood metabolome and can result in the development of additional illnesses.
Renal function and body composition are linked via urate
Urea functions as a mediator, linking the FAT, LIVER, and KIDNEY clusters. Research in the past has linked hyperuricemia to obesity, triglyceride levels that are higher, and visceral fat mass that is raised; their model suggests that these associations are direct. There is evidence that urate not only results from obesity but also plays a role in the development of diabetes and obesity: Diabetes and obesity seem to be predicted by increased urate levels in the blood.
Body composition Is Directly Associated with Hormone Expression
It has become well known that body fat percentage, waist, and hip measurements increase with ageing, and BMI all alter. But in their model, didn’t discover that one of them was specifically related to age. Rather, Age and the fat cluster are all indirectly correlated with one another. Two routes connect the FAT cluster to ageing: urate and renal function. The EXPRESSION cluster is traversed via a second route. Specifically, oxytocin (OXT) expression explains the 6,0 % of all model shortest pathways that go via this cluster.
IgG Glycosylation as a Novel Inflammation-Related Obesity-Associated Mechanism
It is well established that obesity is linked to persistent mild inflammation and immune system activation; it is anticipated to be crucial in influencing how obesity and prevalent co morbidities like type 2 diabetes interact. In their model, inflammatory IgG glycosylation is linked to adipose and visceral fat accumulation via the production of OXT and the age-mgm’s additional consequences. Certain age-mgm outcomes that aren’t covered in depth in the main text are summarized in the image each panel shows a small section of the network that only includes significant edges and nodes.
Limitations and Directions for the Future
This research’s very small sample size of 510 people is a constraint since there aren’t many large collections of clinical phenotypes or multi-omics datasets. Additionally, despite this, were unable to obtain access to similar information from a separate cohort to verify findings. Only have female participants, too. As a result, it’s possible that model and the conclusions they came to from it don’t apply to the full population. While new and bigger multi-omics datasets will soon be made accessible.
CONCLUSION
According to the research, this is the first research to use a composite statistical strategy to combine clinical characteristics and information from four omics technologies. Their model, which is entirely depending on data gathered from a group of individuals who are normally healthy, verifies the causative processes of illness that have previously been discovered using very specialized experiments and clinical trials, despite the comparatively small sample size.They also discovered a number of novel possible pathways that can support disease co-morbidities. For instance, found that the link between body composition, renal function, and several metabolic syndrome phenotypes was strongly influenced by urate. Additionally, by combining several omics datasets discover that Inflammation and obesity are crucially mediated by the hormone oxytocin supporting the idea of inflammation.In light of multivariate relationships, work emphasizes the significance and viability of data integration across omics levels, including phonemics. This will make it easier to concentrate on a small number of intriguing correlations in the future, which both clinical trials and biological models can subsequently openly investigate. By eliminating unnecessary routes and prospective drug targets early on in the research process, this will eventually speed up the discovery of drugs by decreasing the number of potential targets and lowering the cost of drug discovery.
REFERENCES
1. Krystle KQ, Fischinger S, Smith MT, Atyeo C, Cizmeci D, Wolf CR, Layton ED, Logue JK, Aguilar MS, Shuey K, Loos C. Comorbid illnesses are associated with altered adaptive immune responses to SARS-CoV-2. JCI insight. 2021 Mar 22;6(6):e146242. https://doi.org/10.1172/jci.insight.146242
2. Mariano A, Di Lorenzo G, Jannini TB, Santini R, Bertinelli E, Siracusano A, Niolu C. Medical comorbidities in 181 patients with bipolar disorder vs. schizophrenia and related psychotic disorders: findings from a single-center, retrospective study from an acute inpatients psychiatric unit. Frontiers in Psychiatry. 2021 Oct 1;12:702789. https://doi.org/10.3389/fpsyt.2021.702789
3. Dlouha O, Prihodova I, Skibova J, Nevsimalova S. Developmental language disorder: Wake and sleep epileptiform discharges and co-morbid neurodevelopmental disorders. Brain Sciences. 2020 Nov 26;10(12):910. https://doi.org/10.3390/brainsci10120910
4. Kushwaha S, Khanna P, Rajagopal V, Kiran T. Biological attributes of age and gender variations in Indian COVID-19 cases: A retrospective data analysis. Clinical epidemiology and global health. 2021 Jul 1;11:100788. https://doi.org/10.1016/j.cegh.2021.100788
5. Tan XW, Lee ES, Toh MP, Lum AW, Seah DE, Leong KP, Chan CY, Fung DS, Tor PC. Comparison of mental-physical comorbidity, risk of death and mortality among patients with mental disorders—A retrospective cohort study. Journal of psychiatric research. 2021 Oct 1;142:48-53. https://doi.org/10.1016/j.jpsychires.2021.07.039
6. Merga BT, Ayana GM, Raru TB, Alemu A, Negash B, Bekana M, Birhanu A, Dessie Y. Association of pre-existing comorbidities with disease severity among COVID-19 patients in eastern Ethiopia. Infection and Drug Resistance. 2022 Jan 1:2825-34. https://doi.org/10.2147/IDR.S362140
7. Madva EN, Staller K, Huffman JC, Kuo B, Garcia‐Fischer I, Atkins M, Keefer L, Celano CM, Murray HB. Psychiatric comorbidities among adult patients with disorders of gut–brain interaction: Prevalence and relationships to treatment outcomes. Neurogastroenterology& Motility. 2023 Feb;35(2):e14493. https://doi.org/10.1111/nmo.14493
8. Barrett BJ, Parfrey PS, Morgan J, Barre P, Fine A, Goldstein MB, Handa SP, Jindal KK, Kjellstrand CM, Levin A, Mandin H. Prediction of early death in end-stage renal disease patients starting dialysis. American Journal of Kidney Diseases. 1997 Feb 1;29(2):214-22. https://doi.org/10.1016/S0272-6386(97)90032-9
9. Russell CD, Lone NI, Baillie JK. Comorbidities, multimorbidity and COVID-19. Nature medicine. 2023 Feb;29(2):334-43. https://doi.org/10.1038/s41591-022-02156-9
10. Imam Z, Odish F, Gill I, O’Connor D, Armstrong J, Vanood A, Ibironke O, Hanna A, Ranski A, Halalau A. Older age and comorbidity are independent mortality predictors in a large cohort of 1305 COVID‐19 patients in Michigan, United States. Journal of internal medicine. 2020 Oct;288(4):469-76. https://doi.org/10.1111/joim.13119
11. Koi M, Okita Y, Takeda K, Koeppe ES, Stoffel EM, Galanko JA, McCoy AN, Keku T, Carethers JM. Co-morbid risk factors and NSAID use among White and Black Americans that predicts overall survival from diagnosed colon cancer. PLoS One. 2020 Oct 7;15(10):e0239676. https://doi.org/10.1371/journal.pone.0239676
12. Fortuna R, Hart DA, Sharkey KA, Schachar RA, Johnston K, Reimer RA. Effect of a prebiotic supplement on knee joint function, gut microbiota, and inflammation in adults with co-morbid obesity and knee osteoarthritis: study protocol for a randomized controlled trial. Trials. 2021 Dec;22:1-0. https://doi.org/10.1186/s13063-021-05212-w
13. Devlin A, Casey S, Williams S, Giummarra MJ. Association of fear-avoidance and self-efficacy on pain disability in individuals with co-morbid post-traumatic stress and chronic pain. Journal of Health Psychology. 2022 Jan;27(1):188-98. https://doi.org/10.1177/1359105320947819
14. Mysliwiec V, Neylan TC, Chiappetta L, Nofzinger EA. Effects of a forehead cooling device in veterans with chronic insomnia disorder and co-morbid medical and psychiatric conditions: a pilot study. Sleep and Breathing. 2021 Mar;25:441-8. https://doi.org/10.1007/s11325-020-02126-w
15. Mancini MA, Farina AS. Co-morbid mental health issues in a clinical sample of Latinx adults: implications for integrated behavioral health treatment. Journal of Ethnic & Cultural Diversity in Social Work. 2021 Jul 4;30(4):326-40. https://doi.org/10.1080/15313204.2019.1702132
FINANCING
The authors did not receive financing for the development of this research.
CONFLICT OF INTEREST
The authors declare that there is no conflict of interest.
AUTHOR CONTRIBUTIONS
Conceptualization: Chandan Das, Nagireddy Mounika, Shikhar Gupta, Nimesh Raj, Deepak Malla, Naresh Kaushik.
Investigation: Chandan Das, Nagireddy Mounika, Shikhar Gupta, Nimesh Raj, Deepak Malla, Naresh Kaushik.
Methodology: Chandan Das, Nagireddy Mounika, Shikhar Gupta, Nimesh Raj, Deepak Malla, Naresh Kaushik.
Writing - original draft: Chandan Das, Nagireddy Mounika, Shikhar Gupta, Nimesh Raj, Deepak Malla, Naresh Kaushik.
Writing - review and editing: Chandan Das, Nagireddy Mounika, Shikhar Gupta, Nimesh Raj, Deepak Malla, Naresh Kaushik.