doi: 10.56294/mw2024614
ORIGINAL
Evaluation of the usefulness of a predictive model for the diagnosis of COVID-19 in relation to the TR-PCR test and rapid test, in patients at the Univalle Sud Hospital
Evaluación de la utilidad de un modelo predictivo para el diagnóstico de COVID-19 en relación con la prueba de TR-PCR y prueba rápida, en pacientes del Hospital Univalle Sud
Rommer A Ortega-Martinez1 ![]() *, Miguel A Molina-Cardenas1
*, Miguel A Molina-Cardenas1 ![]() *, Carlos E. Román-Calvimontes2
*, Carlos E. Román-Calvimontes2 ![]() *
*
1Universidad Privada del Valle. Cochabamba, Bolivia.
2Universidad Mayor de San Simón, Cochabamba, Bolivia.
Cite as: Ortega-Martinez RA, Molina-Cardenas MA, Román-Calvimontes CE. Evaluation of the usefulness of a predictive model for the diagnosis of COVID-19 in relation to the TR-PCR test and rapid test, in patients at the Univalle Sud Hospital. Seminars in Medical Writing and Education. 2024; 3:614. https://doi.org/10.56294/mw2024614
Submitted: 12-12-2023 Revised: 01-03-2024 Accepted: 10-05-2024 Published: 11-05-2024
Editor: PhD.
Prof. Estela Morales Peralta ![]()
Corresponding author: Rommer A Ortega-Martinez *
ABSTRACT
Objective: early diagnosis for COVID-19 with rapid antigen test (PRA) and real-time polymerase chain reaction (TR-PCR), applying a predictive model.
Method: retro-prospective, observational, longitudinal study; in 2020, a PRA and TR-PCR indication score for COVID-19 was applied to 98 patients (age, fever, respiratory symptoms, chest X-ray, comorbidities, place of residence and work activity); > 4 indicated taking TR-PCR (χ2=0,531, p>0,05), area under the curve (AUC) of 0,5; 3 regression models were performed, the third was more effective (vital signs and clinical signs) to decide positivity; in 2023, 284 patients were included to validate the model.
Results: mean age 47,7±16,7, frequent symptoms with cough, fever and asthenia; mean systolic pressure 119,7±15,6 mmHg and diastolic 74,8±10,9 mmHg; TR-PCR with a sensitivity of 85 %, a validity rate of 49 %; positive predictive value of 48 %; negative predictive value 55 %, positive likelihood ratio 1,019; Cohen’s Kappa index, (κ=0,016, 95 % CI: -0,073 to 0,1).
Conclusions: molecular tests were contrasted with vital signs and clinical signs; We consider that our model can be useful, but its validation still needs to continue and be applied to more patients.
Keywords: COVID-19; Molecular Diagnostic Techniques; Predictive Models; Rapid Diagnostic Tests; Sensitivity; Specificity.
RESUMEN
Objetivo: el diagnóstico precoz, para COVID-19 con prueba rápida de antígeno (PRA) y la reacción en cadena polimerasa en tiempo real (TR-PCR), aplicando un modelo predictivo.
Método: estudio retro-prospectivo, observacional, longitudinal; en 2020 se aplicó a 98 pacientes, un score de indicación de PRA y TR-PCR para COVID-19 (edad, fiebre, sintomatología respiratoria, Rx de tórax, comorbilidades, lugar de residencia y actividad laboral); > de 4 indicaba tomar TR-PCR (χ2=0,531, p>0,05), área bajo la curva (ABC) de 0,5; se practicaron 3 modelos de regresión, el tercero fue más eficaz (signos vitales y clínica), para decidir positividad; el 2023 se incluyeron 284 pacientes para validar el modelo.
Resultados: media de edad 47,7±16,7, síntomas frecuentes con tos, fiebre y astenia; media de presión sistólica 119,7±15,6 mmHg y 74,8±10,9 mmHg diastólica; la TR-PCR con sensibilidad del 85 %, un índice de validez del 49 %; valor predictivo positivo de 48 %; valor predictivo negativo 55 %, razón de verosimilitud positiva de 1,019; índice Kappa de Cohen, (κ=0,016, IC 95 %: -0,073 a 0,1).
Conclusiones: las pruebas moleculares, se contrastaron con signos vitales, clínica; consideramos que nuestro modelo puede ser útil, empero aún se necesita continuar su validación y aplicarlo en más pacientes.
Palabras clave: COVID-19; Modelos Predictivos; Pruebas de Diagnóstico Rápido; Técnicas de Diagnóstico Molecular; Sensibilidad; Especificidad.
INTRODUCTION
An outbreak of a new pneumonia in Wuhan, China, in 2019, caused by the coronavirus (SARS-CoV-2, 2019-nCoV, COVID-19), spread rapidly. 81 % of the patients had mild to moderate pneumonia; in 2020, the mortality rate was 2,3 %.(1,2,3,4) COVID-19 can progress to severe disease with high mortality; the severity factor is males over 65 years of age, who are at a higher risk of requiring intensive care.(3,4)
For detection, rapid antigen tests (RAT) and RT-PCR (reverse transcription polymerase chain reaction) are used; RAT tests began to be marketed in November 2020, and RT-PCR as a complement; RATs detect antigens from nasal swabs and return results in minutes; it has a sensitivity of 40,2 to 74,1 % and a specificity of 93 to 99,8 % in asymptomatic individuals, which is lower than that of RT-PCR (86 to 92 % and 99 %, respectively); however, RAPs are cheaper and easier to implement on a large scale.(2,5)
Hospitals should have RT-PCR and RATs available to detect these patients in the acute, convalescent, or seroconversion stages.(6) The WHO (World Health Organization) mentioned that RT-PCR, performed on blood and respiratory tract samples, was the test of choice for diagnosis.(5,6)
Rapid diagnosis and isolation of people carrying SARS-CoV-2 are key to breaking the transmission chain; RT-PCR is a painful process, it has complications, it requires trained personnel, and it poses a risk of infection for the person taking the sample; thus, several options have emerged, such as that of Kocagoz T et al., where they applied nasal swabs, gargles, and mouthwashes and identified the virus before and after with 76 (66,7 %), 67 (58,8 %) and 101 (88,6 %) respectively.(7)
A prospective cohort from 2022 compared the PRA with the RT-PCR positivity index (0 asymptomatic and two symptomatic); the PRA showed 93,4 % sensitivity at 48 hours in symptomatic patients and, in comparison with the index, the sensitivity rose from 62 to 79 % with the third sample.(8) Another study carried out with the creation of 4 prototypes by 3D of nasopharyngeal swabs found an agreement rate of 80 % (K=0,85-0,89) with RT-PCR tests.(9)
On the other hand, there are many positive patients, while for the negative ones, the possibility cannot be ruled out, generating false negatives, which represent a threat to the community; thus, there are other diagnostic options, such as checklists, 3D devices, etc.; in this way, after the invention of a prediction score, both for the PRA and the RT-PCR, a predictive model was created with clinical and epidemiological variables and vital signs, which was applied to people who had COVID-19; in this way, it was possible to make a comparison of whether or not this model is helpful for the diagnosis of COVID-19, as opposed to the rapid test or RT-PCR
METHOD
The present work arose from a retrospective study carried out between July and September 2020, where a score for the indication of RT-PCR for COVID-19 was created and applied in 98 patients (age, fever, respiratory symptoms, chest X-ray, comorbidities, place of residence and work activity), where a value > 4 indicated the need to take an RT-PCR about a PRA; however, it was shown that there is no relationship to indicate RT-PCR or PRA (χ2=0,531, P>0,05), with an AUC of 0,5 (p-value= >0,05) (see additional file 1 [https://drive.google.com/file/d/1kjvPcL_JBXbbohTr67MlNftNk4y66Wif/view]); subsequently, three binary logistic regression models were performed, where the third allowed the creation of a predictive model to decide on the positivity of a RT-PCR or PRA.
Subsequently, two stages were applied to evaluate the predictive model’s usefulness based on an observational, analytical, retrospective, and cross-sectional study. In the first stage, between January and July 2023, 163 patients from the Univalle Sud hospital were included. A descriptive analysis was carried out to validate the predictive model, with summary tables of information about the covariates; on the other hand, the results of the model were presented, contrasted with the laboratory results; for vital signs, box plots were presented, discriminated according to the positive or negative result for COVID-19.
The model was evaluated using a relational analysis between its output and the RT-PCR results. It was also used for the laboratory results and the different covariates, using the χ2 independence test or Fisher’s exact test. Subsequently, Cohen’s Kappa index (κ) was determined for valid cases. Additionally, sensitivity, specificity, positive predictive value, negative predictive value, and likelihood ratio values were determined.
In the second stage, between August and September 2023, taking into account specificity and negative predictive value as null, it was decided to expand the sample, especially considering a more significant number of cases with negative RT-PCR, so from 121 patients, 163 were added, with a total of 284 cases; Similarly, the model results and the laboratory results were contrasted using a χ2 independence test and the calculation of Cohen’s kappa index (κ); only the RT-PCR laboratory test was performed, because the rapid test was not performed in about 50 % (n=143). The process was carried out in R v. 4.2.2, SPSS v. 19, and Excel v. 2018
RESULTS
The average age was 47,7±16,7 years, higher in women than in men, with 48±18 years and 47±16 years, respectively (p>0,05). The most frequent symptoms were cough, fever, and asthenia, with 55 %, 60 %, and 69 %, respectively; the frequencies recorded show a significant relationship with the results of the model for fever, asthenia, and dyspnea (p<0,05) (table 1).
|
Table 1. Frequency of cases for model covariates, according to modeled results for PCR |
||||
|
Characteristics |
General N=2841 |
Negative, N=421 |
Positive, N=2421 |
Value of p2 |
|
Cough |
|
|
|
0,2 |
|
Absent |
74 (45 %) |
7 (33 %) |
67 (47 %) |
|
|
Present |
89 (55 %) |
14 (67 %) |
75 (53 %) |
|
|
Not registered |
121 |
21 |
100 |
|
|
Fever |
|
|
|
0,002 |
|
Absent |
65 (40 %) |
15 (71 %) |
50 (35 %) |
|
|
Present |
98 (60 %) |
6 (29 %) |
92 (65 %) |
|
|
Not registered |
121 |
21 |
100 |
|
|
Asthenia |
|
|
|
0,001 |
|
Absent |
50 (31 %) |
0 (0 %) |
50 (35 %) |
|
|
Present |
113 (69 %) |
21 (100 %) |
92 (65 %) |
|
|
Not registered |
121 |
21 |
100 |
|
|
Headache |
|
|
|
0,7 |
|
Absent |
95 (58 %) |
13 (62 %) |
82 (58 %) |
|
|
Present |
68 (42 %) |
8 (38 %) |
60 (42 %) |
|
|
Not registered |
121 |
21 |
100 |
|
|
Dyspnea |
|
|
|
0,038 |
|
Absent |
90 (55 %) |
16 (76 %) |
74 (52 %) |
|
|
Present |
73 (45 %) |
5 (24 %) |
68 (48 %) |
|
|
Not registered |
121 |
21 |
100 |
|
|
Myalgia |
|
|
|
0,4 |
|
Absent |
84 (52 %) |
9 (43 %) |
75 (53 %) |
|
|
Present |
79 (48 %) |
12 (57 %) |
67 (47 %) |
|
|
Not registered |
121 |
21 |
100 |
|
|
Characteristics |
General N=2843 |
Negative, N=423 |
Positive, N=2423 |
Value of p4 |
|
Systolic pressure (mmHg) |
120 (110, 130) |
110 (100, 120) |
120 (110, 130) |
<0,001 |
|
Diastolic pressure (mmHg) |
80 (70, 80) |
70 (60, 70) |
80 (70, 80) |
<0,001 |
|
Mean arterial pressure (mmHg) |
91 (83, 97) |
80 (73, 90) |
92 (87, 97) |
<0,001 |
|
Heart rate |
90 (81, 105) |
87 (76, 100) |
90 (81, 105) |
0,4 |
|
Respiratory rate |
22 (18, 24) |
20 (20, 24) |
22 (18, 24) |
>0,9 |
|
Temperature (°C) |
36,70 (36,40- 37,50) |
36,50 (36,30-36,70) |
36,70 (36,40-37,50) |
0,010 |
|
Oxygen saturation (%) |
89 (84, 92) |
86 (82, 93) |
90 (85, 92) |
0,14 |
|
Note: 1n (%); 2Pearson’s chi-squared test; 3Median, interquartile range (IQR); 4Wilcoxon rank sum test. |
||||
The mean systolic pressure was 119,7±15,6 mmHg, with a mean diastolic pressure of 74,8±10,9 mmHg; neither the pressures nor the heart or respiratory rates usually behaved (table 1), in terms of the median (P50) and interquartile range (IQR). The recorded pressures and temperature are related to the group to which the positive TR-PCR test prediction model result for COVID-19 belongs (p<0,05). On the other hand, it can be seen that the estimators for the group predicted as positive for the TR-PCR test are higher in all vital signs.
Figure 1 presents the distribution of values recorded for the groups according to the result of the COVID-19 case prediction model in the RT-PCR test.
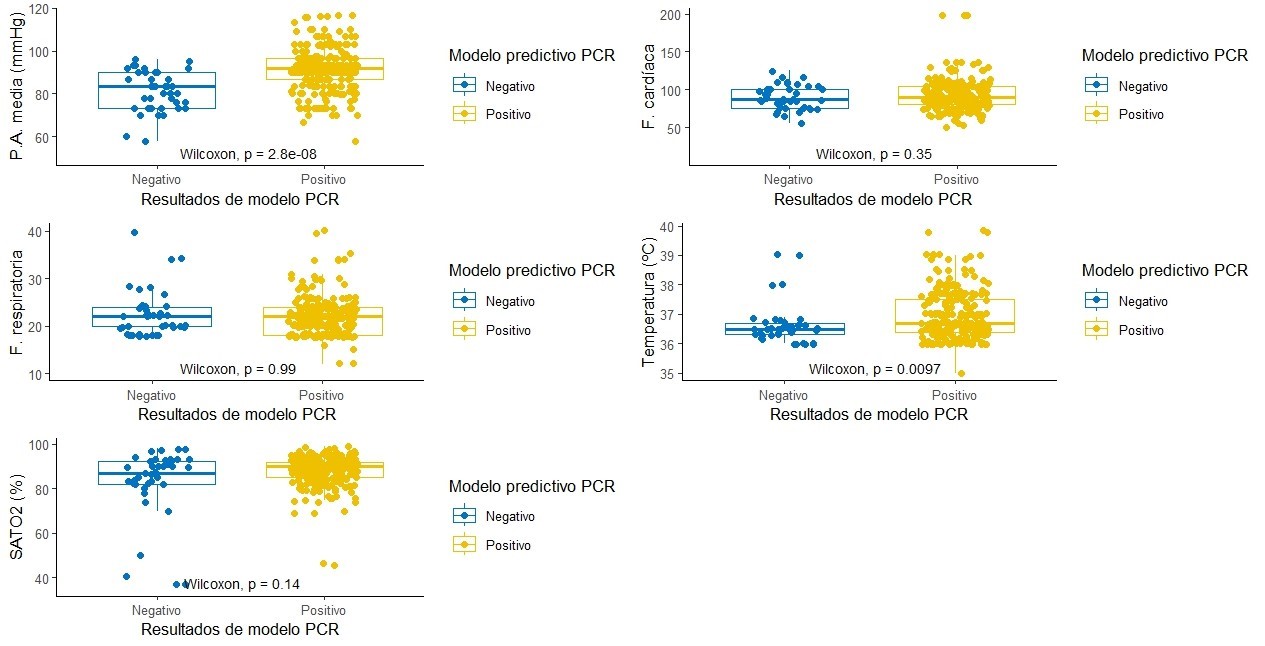
Figure 1. Vital sign measurement results according to predictive model results for CRP
Within the validation process of the model for the rapid test, the proportion of cases in which it was not performed was 89 % (n=143), so the values that could be contrasted between the prediction model for the rapid test and the observed values of the rapid test lack relevance; for this reason, an additional validation process was ruled out.
Around 16 % of the cases were not analyzed by RT-PCR (n=45); the observed result of positive cases was 113. The model cataloged these in 85 % of the occasions (n=96); however, the model was not successful for 17 % of the cases of negative RT-PCR (n=21). The χ2 test of independence indicates that there is no relationship between the observed and modeled levels (p>0,05) (table 2).
|
Table 2. Contingency matrix for PCR model results and results observed in PCR laboratory |
|||||
|
Characteristics |
General, N=2841 |
Negative, N=1261 |
Not realized, N=451 |
Positive, N=1131 |
Value of p2 |
|
PCR model result |
|
|
|
|
0,4 |
|
Negative |
42 (15 %) |
21 (17 %) |
4 (8,9 %) |
17 (15 %) |
|
|
Positive |
242 (85 %) |
105 (83 %) |
41 (91 %) |
96 (85 %) |
|
|
Note: 1n (%); 2 Pearson’s chi-squared test. |
|||||
Graphically, the proportion of correct and incorrect predictions of the model can be better appreciated regarding the laboratory results (figure 2); the number of cases in which the laboratory analysis was not performed could generate random results. Disregarding the instances in which the RT-PCR test was not performed, the contingency matrix shows a validity or accuracy index of 49 %; sensitivity is high (85 %), although the positive predictive value is moderate (48 %); on the other hand, the positive likelihood ratio is 1,019; however, both specificity (17 %) and negative predictive value (55 %) reflect the weakness of the model for true negatives.
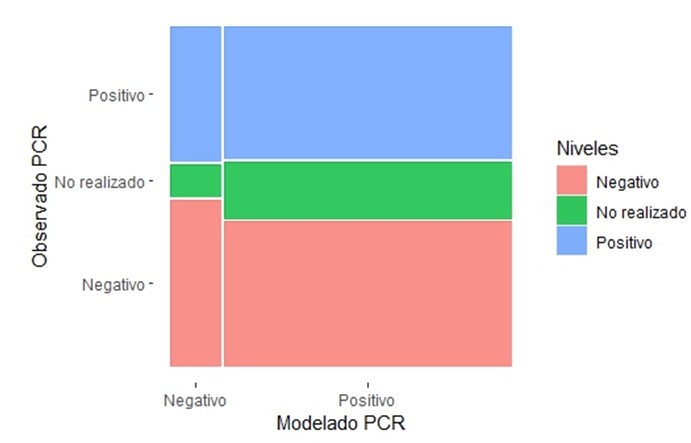
Figure 2. Mosaic diagram between model results and PCR test results
Cohen’s Kappa index indicates an insignificant concordance between the modeling values and laboratory results due to the influence of the model’s weakness in classifying the actual negative values (κ=0,016, 95 % CI: -0,073 to 0,1).
DISCUSSION
The impact of the COVID-19 pandemic reflected the lack of resources to deal with a misfortune of this magnitude and an economic shock; this drawback was exposed in contrast to early diagnosis and suitable treatment; on the other hand, it demonstrated the fragility of being; in this way, this study showed an average age of 47,7±16,7 years, with no significant difference between men and women (p-value >0,05); very similar to the survey by Soni A. et al where they presented a mean of 37,4 years (8) and others took into account varied age groups with ranges from 2 to 90 years or the majority over 18 years.(7,9)
The symptoms are respiratory, such as cough, fever, and asthenia, with 55 %, 60 %, and 69 %, respectively, as in the study by Achenbach C. et al., which showed more than 40 % with cough, fever, and headache.(10,11,12,13) Based on vital signs in the prediction score and the third prediction model, it has been observed that blood pressure and temperature are related to the prediction group for the positive RT-PCR test (p-value =<0,001); similarly, a study with a similar structure to ours, by Youssef Ali Amer A. et al. in Belgium, with the creation of five predictive models, using vital signs, determined a prediction of health status for COVID-19, with 8 %, 4,8 %, and 17,8 % for heart rate, oxygen saturation, and respiratory rate respectively, dissimilar to our findings.(14)
Due to a reduced performance of RAT, the validation process for this model only considered Fisher’s exact test; according to the test, the results of the model are independent of the laboratory results (p>0,05); however, in a study by Callahan C. et al., where it reflects the usefulness of nasopharyngeal swabs as a rapid 3D antigen test in comparison with a positivity index of RT-PCR; the PRA showed 93,4 % sensitivity at 48 hours in symptomatic patients, and in contrast with the index the sensitivity rose to 79 % with the third sample;(8,13) Another study involving the creation of four prototypes by 3D printing of nasopharyngeal swabs found an 80 % concordance rate (K=0,85-0,89) with RT-PCR tests,(9,13) which expresses a dissimilarity with our environment due to the low Kappa index since the tendency is to request more RT-PCR tests.
Molecular tests have undergone technological evolution, as in the study by Bos D. et al. where they revealed that a rapid COVID-19 RT-PCR test (diagnostics ®) achieved a sensitivity of 95,5 % to 98,6 %;(14,15) similarly, were compared to the classic nasal swab, gargles and mouthwashes as molecular tests, before and after, showing 76 (66,7 %), 67 (58,8 %) and 101 (88,6 %) sensitivity respectively;(7,14) in our study, the model adequately cataloged 85 % of the cases, which is reflected in high values of sensitivity, likelihood ratio, and positive predictive value; the index of validity or overall accuracy is also reasonable (81,4 %); however, specificity and negative predictive value are zero.
In another study by Joshi R. et al., where they used a blood count based on a predictive model and confirmed RT-PCR (+) in 33 patients and RT-PCR (-) in 357 patients in emergency departments, demonstrated a sensitivity of 93 %, with a saving of more than 30 % compared to RT-PCR; they indicate that out of 1000 patients, 60 % would avoid ordering RT-PCR; in our case, when the patient is symptomatic, the model can coincide with the laboratory in at least 8 out of 10 cases.(15,16)
Compared to chest CT and the patient’s clinical history, artificial intelligence demonstrated an AUC of 0,92, identifying RT-PCR (+) at 68 %, as demonstrated by Mei X. et al. in China.(17) In another study in 2023, led by Alemi F. et al., where they applied clinical aspects identified by predictive models in addition to a rapid home test, obtaining a sensitivity of 69 % and specificity of 98 % for a TR-PCR (+),(18) not so in ours, which identified an 85 % sensitivity, mainly due to the number of negative results; in contrast, another study using a diagnostic analyzer for PCR, selective hybridization (DASH), which also used the rapid test, reflected a sensitivity of 96 % and specificity of 98 %; a PPV of 85 % and 99 % NPV.(13,18)
There is no agreement between the model results and the observations, reflected in the value of Cohen’s Kappa index (κ=0,016), in contrast to other studies, such as Callahan CJ. et al., where using swabs made by 3D, a concordance of κ=0,85-0,89 was demonstrated;(9,18) the results indicate the need to increase the sample, considering negative RT-PCR values; the model adequately classified 85 % of positive cases, which is corroborated by its sensitivity values and positive likelihood ratio; it is weak in the classification of actual negative cases, reflected in a reduced specificity (17 %) and a moderate negative predictive value (NPV).
Following the line of versatile tests, Zowawi HM et al., 2021 developed a portable device (Biomeme SARS-CoV-2® System), using nasal and nasopharyngeal swabs, which provides a molecular result in 80 minutes, with a percentage of similarity for positive (99 %) and negative (97,8 %). However, in our study, it reaches 85 %; it is still a relevant system,(1,17) from another point of view. In 2023, an ultra-fast PRA was evaluated in comparison with TR-PCR (Diagnovir ®), reflecting a sensitivity of 100 and 96,97 %, respectively, not so in our study, which showed 85 %; specificity with 94 and 99,2 %, different from ours, showing that our model still needs more testing and validation.(2,18)
CONCLUSIONS
The need for accessible, affordable, easy-to-use, and reliable tests has led to testing various techniques, scores, 3D swabs, and, in many cases, the application of artificial intelligence. Still, so far, none have been recommended. Therefore, the model in this study, with zero specificity, should be considered in the diagnosis due to its sensitivity. However, more patients may indeed be needed, adequately combining positive and negative results for RT-PCR and evaluating whether it is possible to continue requesting PRA since lately, it has been common to request only molecular tests; from another perspective, it is vital to apply this model in other institutions looking for more heterogeneous patients.
BIBLIOGRAPHICAL REFERENCES
1. Callahan CJ, Lee R, Zulauf KE, Tamburello L, Smith KP, Previtera J, et al. Open Development and Clinical Validation of Multiple 3D-Printed Nasopharyngeal Collection Swabs: Rapid Resolution of a Critical COVID-19 Testing Bottleneck. J Clin Microbiol [Internet]. 2020 Aug 1 [cited 2024 Nov 25];58(8). Available from: https://pubmed.ncbi.nlm.nih.gov/32393482/
2. Zowawi HM, Alenazi TH, AlOmaim WS, Wazzan A, Alsufayan A, Hasanain RA, et al. Portable RT-PCR System: a Rapid and Scalable Diagnostic Tool for COVID-19 Testing. J Clin Microbiol [Internet]. 2021 May 1 [cited 2024 Dec 4];59(5). Available from: https://pubmed.ncbi.nlm.nih.gov/33674285/
3. Seymen AA, Gulten E, Ozgur E, Ortaç B, Akdemir I, Cinar G, et al. Clinical evaluation of DIAGNOVIR SARS-CoV-2 ultra-rapid antigen test performance compared to PCR-based testing. Sci Rep [Internet]. 2023 Dec 1 [cited 2024 Dec 4];13(1). Available from: https://pubmed.ncbi.nlm.nih.gov/36932107/
4. Pan Y, Li X, Yang G, Fan J, Tang Y, Zhao J, et al. Serological immunochromatographic approach in diagnosis with SARS-CoV-2 infected COVID-19 patients. J Infect [Internet]. 2020 Jul 1 [cited 2024 Nov 24];81(1):e28–32. Available from: https://pubmed.ncbi.nlm.nih.gov/32283141/
5. Brodin P. Immune determinants of COVID-19 disease presentation and severity. Nature Medicine 2021 27:1 [Internet]. 2021 Jan 13 [cited 2024 Nov 24];27(1):28–33. Available from: https://www.nature.com/articles/s41591-020-01202-8
6. Wu S, Archuleta S, Ming LS, Somani J, Chye QS, Fisher D. Serial antigen rapid testing in staff of a large acute hospital. Lancet Infect Dis [Internet]. 2022 Jan 1 [cited 2024 Nov 24];22(1):14–5. Available from: https://pubmed.ncbi.nlm.nih.gov/34883064/
7. Chen J, Niu Z, Li H, Tang D, Zhang P. Analysis of Nucleic Acid and Antibody Detection Results for SARS-CoV-2 Infection. Arch Iran Med [Internet]. 2021 May 1 [cited 2024 Nov 24];24(5):427–33. Available from: https://pubmed.ncbi.nlm.nih.gov/34196209/
8. Kocagoz T, Can O, Yurttutan Uyar N, Aksoy E, Polat T, Cankaya D, et al. Simple concentration method enables the use of gargle and mouthwash instead of nasopharyngeal swab sampling for the diagnosis of COVID-19 by PCR. Eur J Clin Microbiol Infect Dis [Internet]. 2021 Dec 1 [cited 2024 Nov 24];40(12):2617–22. Available from: https://pubmed.ncbi.nlm.nih.gov/34448088/
9. Soni A, Herbert C, Lin H, Yan Y, Pretz C, Stamegna P, et al. Performance of Rapid Antigen Tests to Detect Symptomatic and Asymptomatic SARS-CoV-2 Infection : A Prospective Cohort Study. Ann Intern Med [Internet]. 2023 Jul 1 [cited 2024 Nov 24];176(7):975–82. Available from: https://pubmed.ncbi.nlm.nih.gov/37399548/
10. SOLUTION: Essential medical statistics 2nd ed b kirkwood j sterne wiley blackwell 2003 ww - Studypool [Internet]. [cited 2024 Nov 22]. Available from: https://www.studypool.com/documents/16816205/essential-medical-statistics-2nd-ed-b-kirkwood-j-sterne-wiley-blackwell-2003-ww
11. Roman J _Francisco. Guía Práctica del Curso de Bioestadística Aplicada a las Ciencias de la Salud [Internet]. [cited 2024 Nov 22]. Available from: https://www.academia.edu/10906749/Gu%C3%ADa_Pr%C3%A1ctica_del_Curso_de_Bioestad%C3%ADstica_Aplicada_a_las_Ciencias_de_la_Salud
12. Montgomery D, Runger GC. Probabilidad y estadística para ingenieros - Montgomery y Runger - III Ed. Probabilidad y Estadística aplicadas a la Ingeniería [Internet]. 2003 [cited 2024 Nov 22];486. Available from: https://www.academia.edu/10272859/Probabilidad_y_estad%C3%ADstica_para_ingenieros_Montgomery_y_Runger_III_Ed
13. Achenbach CJ, Caputo M, Hawkins C, Balmert LC, Qi C, Odorisio J, et al. Clinical evaluation of the Diagnostic Analyzer for Selective Hybridization (DASH): A point-of-care PCR test for rapid detection of SARS-CoV-2 infection. PLoS One [Internet]. 2022 Jun 1 [cited 2024 Nov 26];17(6):e0270060. Available from: https://journals.plos.org/plosone/article?id=10.1371/journal.pone.0270060
14. Amer AYA, Wouters F, Vranken J, Dreesen P, Boer D de K de, Rosmalen F van, et al. Vital Signs Prediction for COVID-19 Patients in ICU. Sensors (Basel) [Internet]. 2021 Dec 1 [cited 2024 Nov 26];21(23):8131. Available from: https://pmc.ncbi.nlm.nih.gov/articles/PMC8662454/
15. Bos DAG, Lagrou K, Verbakel JY. Prospective Performance Evaluation of the miDiagnostics COVID-19 PCR Test for Rapid SARS-CoV-2 Detection on Nasopharyngeal Swabs. J Clin Microbiol [Internet]. 2023 May 1 [cited 2024 Nov 26];61(5). Available from: https://pubmed.ncbi.nlm.nih.gov/37093001/
16. Joshi RP, Pejaver V, Hammarlund NE, Sung H, Lee SK, Furmanchuk A, et al. A predictive tool for identification of SARS-CoV-2 PCR-negative emergency department patients using routine test results. J Clin Virol [Internet]. 2020 Aug 1 [cited 2024 Nov 26];129. Available from: https://pubmed.ncbi.nlm.nih.gov/32544861/
17. Mei X, Lee HC, Diao K yue, Huang M, Lin B, Liu C, et al. Artificial intelligence-enabled rapid diagnosis of patients with COVID-19. Nat Med [Internet]. 2020 Aug 1 [cited 2024 Dec 1];26(8):1224–8. Available from: https://pubmed.ncbi.nlm.nih.gov/32427924/
18. Alemi F, Vang J, Bagais WH, Guralnik E, Wojtusiak J, Moeller FG, et al. Combined Symptom Screening and At-Home Tests for COVID-19. Qual Manag Health Care [Internet]. 2023 Jan 1 [cited 2024 Dec 1];32(Suppl 1):S11–20. Available from: https://pubmed.ncbi.nlm.nih.gov/36579704/
ACKNOWLEDGMENTS
We would like to thank the Universidad Privada del Valle, Cochabamba, Bolivia, for their support and assistance in the statistical analysis of the data.
FINANCING
The authors did not receive funding for the development of this research.
CONFLICT OF INTEREST
The authors declare that there is no conflict of interest.
AUTHORSHIP CONTRIBUTION
Conceptualization: Rommer A Ortega-Martinez, Miguel A Molina-Cardenas, Carlos E. Román-Calvimontes.
Data curation: Rommer A Ortega-Martinez, Miguel A Molina-Cardenas, Carlos E. Román-Calvimontes.
Formal analysis: Rommer A Ortega-Martinez, Miguel A Molina-Cardenas, Carlos E. Román-Calvimontes.
Research: Rommer A Ortega-Martinez, Miguel A Molina-Cardenas, Carlos E. Román-Calvimontes.
Methodology: Rommer A Ortega-Martinez, Miguel A Molina-Cardenas, Carlos E. Román-Calvimontes.
Project Management: Rommer A Ortega-Martinez, Miguel A Molina-Cardenas, Carlos E. Román-Calvimontes.
Resources: Rommer A Ortega-Martinez, Miguel A Molina-Cardenas, Carlos E. Román-Calvimontes.
Software: Rommer A Ortega-Martinez, Miguel A Molina-Cardenas, Carlos E. Román-Calvimontes.
Supervision: Rommer A Ortega-Martinez, Miguel A Molina-Cardenas, Carlos E. Román-Calvimontes.
Validation: Rommer A Ortega-Martinez, Miguel A Molina-Cardenas, Carlos E. Román-Calvimontes.
Visualization: Rommer A Ortega-Martinez, Miguel A Molina-Cardenas, Carlos E. Román-Calvimontes.
Editing - original draft: Rommer A Ortega-Martinez, Miguel A Molina-Cardenas, Carlos E. Román-Calvimontes.